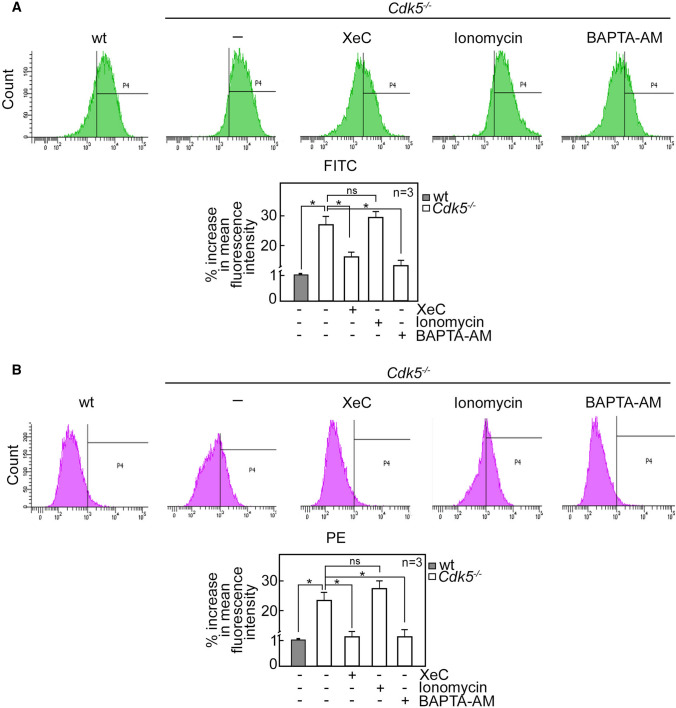
Fig. 7.
[Ca2+]cyt regulates ROS production in Cdk5−/− MEFs. Wt and Cdk5−/− MEFs treated with 3 µM XeC, 10 µM ionomycin or 50 µM BAPTA-AM then stained with DCFDA (A) or mitoSOX red (B) were subjected to flow cytometry to measure cytoplasmic and mitochondrial ROS levels, respectively. Graphs (lower panels) show the % increase in mean fluorescence intensity. Values from wt MEFs were normalized to 1.0. Values are means ± SEM from three independent experiments (n = 3). *p < 0.05. ns: not significant, FITC: Fluorescein isothiocyanate, PE: Phycoerythrin

