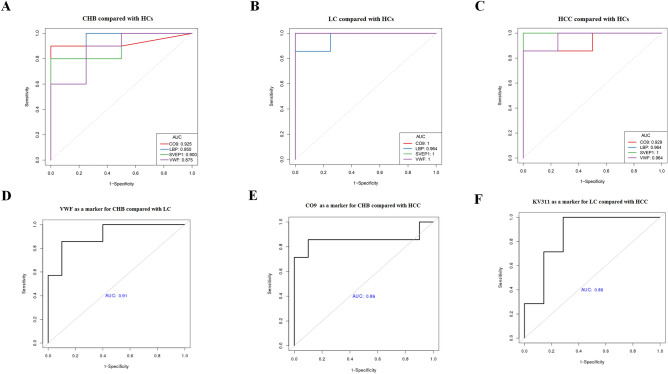
Figure 5.
Diagnostic prediction (Receiver Operating Characteristics (ROC) curves and area under the curve (AUC) values) of the selected serum liquid biopsy biomarkers. AUC values were calculated by stepwise logistic regression algorithm, and then the graphs were drawn by R's own program. CO9, LBP, SVEP1 and VWF levels for diagnosing patients with chronic hepatitis B virus infection (CHB) (A), liver cirrhosis (LC) (B), and hepatocellular carcinoma (HCC) (C) compared with healthy controls (HCs). AUC values of VWF as a marker for diagnosing CHB compared with LC (D). AUC values of CO9 as a marker for diagnosing CHB compared with HCC (E). AUC values of KV311 as a marker for diagnosing LC compared with HCC (F).

