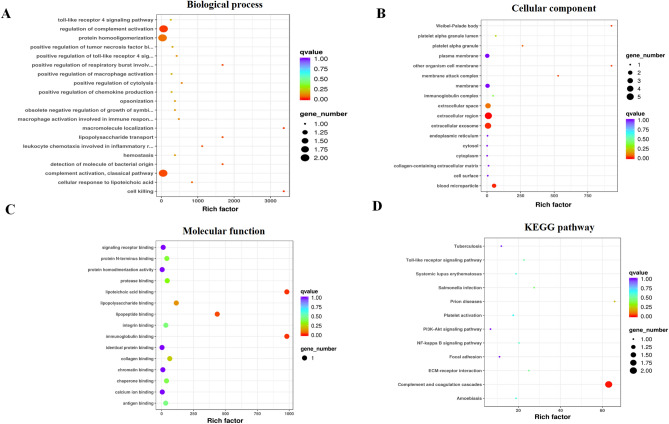
Figure 6.
Gene Ontology (GO) and Kyoto Encyclopedia of Genes and Genomes (KEGG) enrichment analysis of differentially expressed proteins identified in serum EVs (sEVs). The Bubble plots were drawn by the R program. And the R program was written after enrichment significance, which was calculated by Fisher’s exact test. Bubble plots showing enrichment for the GO biological process (A), cellular component (B), and molecular function (C). A bubble plot showing enrichment for KEGG pathways (D).

