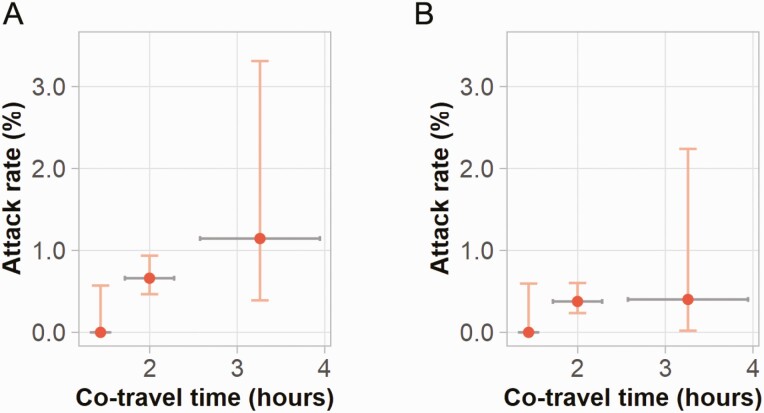
Figure 3.
Relationships between COVID-19 attack rate and co-travel time on airplane departing from Wuhan, as of 23 January 2020. A, Upper bounds of attack rates on airplanes. B, Lower bounds of attack rates on airplanes. Vertical bars show 95% confidence interval of attack rate estimates; horizontal bars represent the standard deviation of co-travel time. Abbreviation: COVID-19, coronavirus disease 2019.

