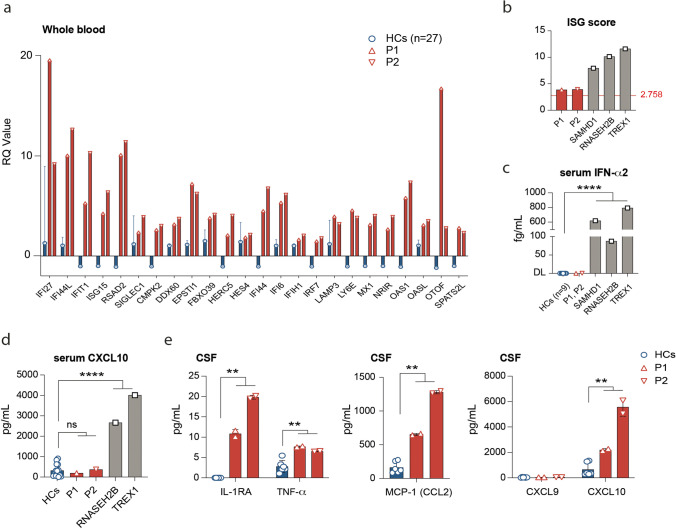
Fig. 3.
AGS patients P1 and P2 display a systemic type I interferon signature and increased IFN-I-inducible cytokines in CSF. a Relative quantification (RQ) of 24 ISGs in whole blood of RNU7-1-mutated patients (P1, P2) compared to healthy controls (n = 27). b ISG scores calculated from the median fold induction of a set of 24 ISGs (see “Methods,” normal < 2.758) of P1, P2, and AGS patients without RNU7-1 mutations, but harboring biallelic mutations in SAMHD1 (n = 1), RNASEH2B (n = 1), or TREX1 (n = 1). c Measurement of IFN-α2 in serum by MSD (Meso Scale Discovery) in P1 and P2 compared to HCs (n = 9) and other AGS genotypes (DL, detection limit). d Measurement of CXCL10 in the serum of P1 and P2 compared to HCs (n = 14) and other AGS genotypes. e Cytokine profiling in CSF including IL-1RA, TNF, MCP-1 (CCL2), CXCL9, and CXCL10 of P1 and P2 compared to HCs (n = 3). Data shown represents mean and s.d. of n = 2 technical replicates. **P < 0.01, ****P < 0.0001, by non-parametric unpaired Mann–Whitney U test

