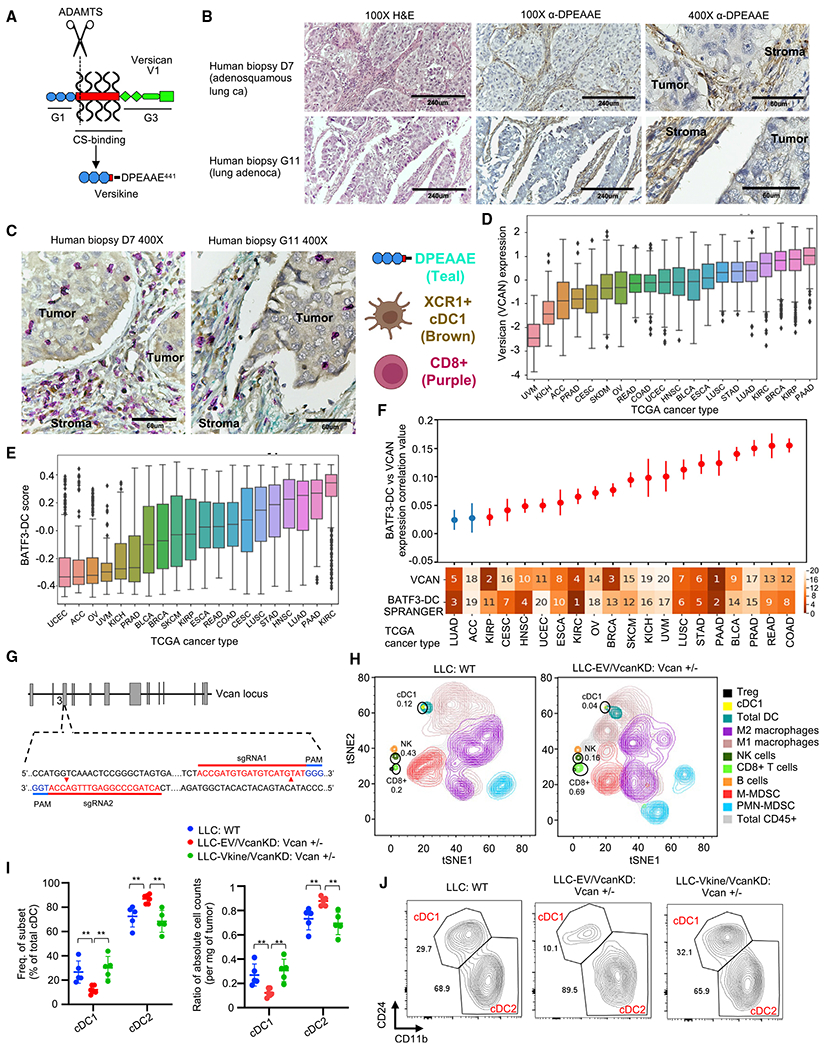
Figure 1. The VCAN pathway regulates tumor cDC1s.

For a Figure360 author presentation of this figure, see https://doi.org/10.1016/j.celrep.2022.111201.
(A) Schematic showing versican (VCAN)-V1 functional domains and site-specific proteolysis to generate versikine (scissors represent ADAMTS proteolytic cleavage). CS, chondroitin sulphate.
(B) Stromal distribution of anti-DPEAAE IHC staining in human lung cancers. DPEAAE constitutes the C terminus of versikine (chromogen, DAB; counterstain, hematoxylin). 10× objective: scale bars, 240 μm; 40× objective: scale bars, 60 μm.
(C) Triple IHC staining of human lung cancers (DPEAAE, teal; XCR1, brown; CD8, purple).
(D) Distribution of VCAN expression across TCGA carcinomas (gdc.cancer.gov), ordered on the horizontal axis by median VCAN expression.
(E) Distribution of cDC1 (BATF3-DC) score across TCGA carcinomas, ordered on the horizontal axis by median measured cDC1 score.
(F) Levels of correlation between cDC1 (BATF3-DC) score and VCAN expression across TCGA carcinomas. The ranked median of VCAN expression and measured cDC1 (BATF3-DC) score is shown across the x axis (1, highest; 20, lowest). Significant (q < 0.1) correlations after multiple hypothesis correction are colored red. Error bars represent the standard error of the correlation coefficient measured using Python statsmodels.
(G) Generation of Vcan+/− mice through CRISPR-Cas9-based targeting of Vcan exon 3.
(H) Mass cytometry of CD45+ cells from WT (LLC implanted into WT recipients, left) and Vcan-depleted tumors (LLCVcanKD tumor cells implanted into Vcan+/− recipients, right).
(I) Quantification of frequency (left) and absolute count ratios (cDC1/cDC1+cDC2 and cDC2/cDC1+cDC2) in WT, Vcan-depleted (LLC-EVVcanKD: Vcan+/−), and versikine (Vkine)-rescued (LLC-VkineVcanKD: Vcan+/−) tumors. Data are presented as mean ± SEM. n = 5 for each group. *p < 0.05, **p < 0.01, ***p < 0.001.
(J) Representative flow cytometry plots showing cDC1 and cDC2 frequency in WT, Vcan-depleted (LLC-EVVcanKD: Vcan+/−), and Vkine-rescued (LLC-VkineVcanKD: Vcan+/−) tumors (gating according to Figure S1F).
In vitro experiments were performed in technical triplicates. In vivo cohort sizes are shown in individual panels. All experiments were reproduced independently at least twice.
