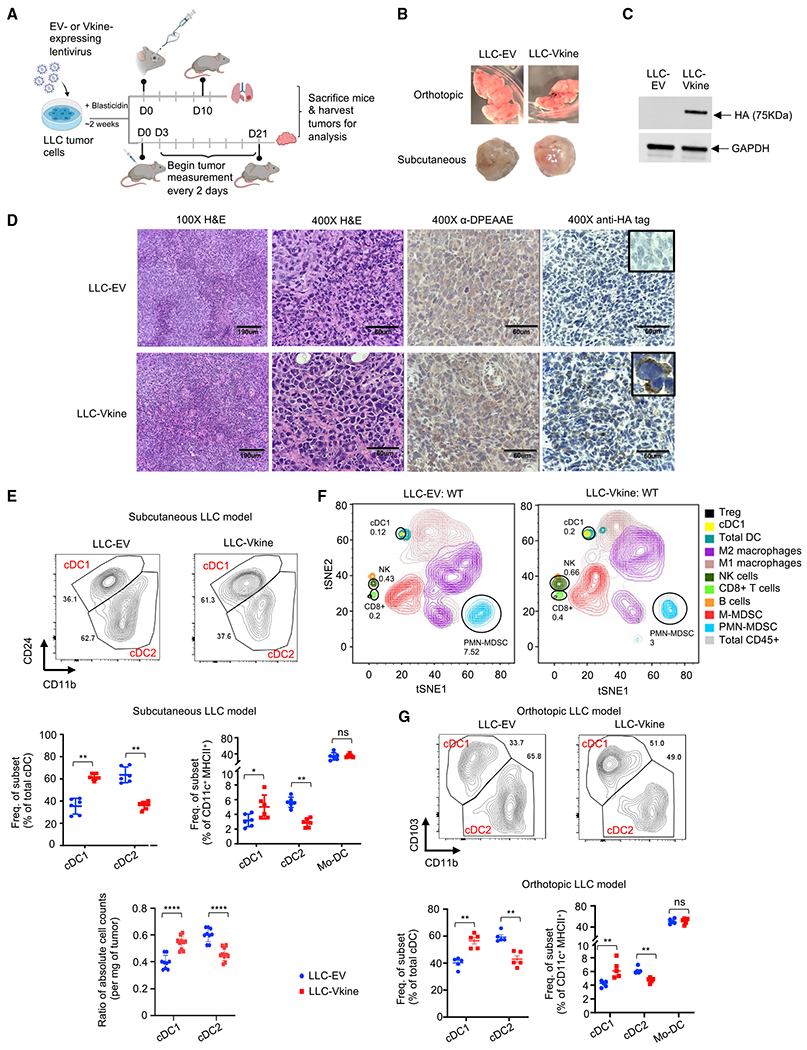
Figure 2. The VCAN-matrikine versikine promotes cDC1 abundance in vivo.

(A) Schematic of the experiment. LLC tumor cells were engineered to express hemagglutinin (HA)-tagged versikine (LLC-Vkine) or empty vector controls (LLC-EV) and injected subcutaneously (s.c.) on the flank or intravenously using a retro-orbital approach.
(B) Gross morphology of orthotopic (top) and s.c. (bottom) LLC-EV and LLC-Vkine tumors.
(C) Anti-HA tag western blotting detects a 75-kDa band in LLC-Vkine tumor lysates, consistent with versikine. See the full blot in Figure S2A.
(D) Representative immunohistochemistry (IHC) images showing α-DPEAAE and HA tag staining of LLC-EV and LLC-Vkine tumors. Endogenous DPEAAE proteolysis is low level and similar between LLC-EV and LLC-Vkine. Anti-HA staining localizes in a membranous distribution in LLC-Vkine cells (inset, larger magnification).
(E) Flow cytometric analysis of cDC subsets in s.c. LLC-EV and LLC-Vkine tumors (gating strategy according to Figure S1F) (Laoui et al., 2016) and quantification of cDC and tumor-associated DC (TADC) frequency (top) and absolute count ratios (cDC1/cDC1+cDC2 and cDC2/cDC1+cDC2) (bottom).
(F) Comparison of immune contexture (CD45+ fraction) in LLC-EV versus LLC-Vkine tumors by 31-marker mass cytometry.
(G) Flow cytometry analysis of cDC subsets in orthotopic LLC-EV and LLC-Vkine tumors (lung metastases induced by intravenous injection). A summary of cDC and TADC subset frequencies is depicted on the right.
Data are presented as mean ± SEM and are from one of three independent experiments with n = 5 or 6 for each group. *p < 0.05, **p < 0.01, ***p < 0.001. In vitro experiments were performed in technical triplicates. In vivo cohort sizes are shown in individual panels. All experiments were reproduced independently at least twice.
