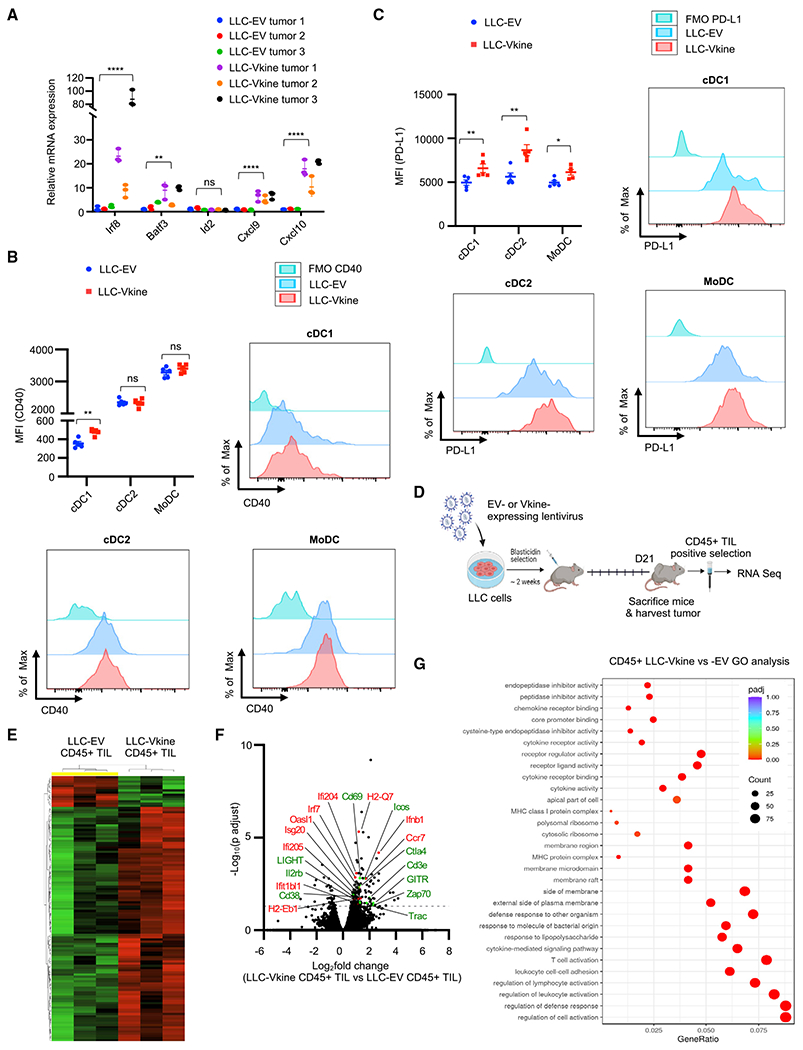
Figure 3. Versikine selectively activates cDC1 in vivo.

(A) RT-PCR analysis for cDC1 “signature” transcripts in bulk LLC-EV and LLC-Vkine tumor mRNA. Data are presented as mean ± SEM.
(B) Summary of CD40 staining intensity (MFI, mean fluorescence intensity) in DC subsets from LLC-EV and LLC-Vkine tumors (experiment 1). A second, independent experiment (experiment 2) is depicted in Figure S3F. Examples of individual histogram plots for each DC subset are shown.
(C) Summary of PD-L1 staining intensity in DC subsets from LLC-EV and LLC-Vkine tumors. Examples of individual histogram plots for each DC subset are shown.
(D) Layout of the experiment to compare transcriptomic profiles in LLC-EV versus LLC-Vkine tumor immune infiltrates.
(E) Hierarchical clustering of transcriptomic profiles by RNA sequencing (RNA-seq) analysis of CD45+ tumor-infiltrating leukocytes (TILs) extracted from LLC-EV versus LLC-Vkine tumors.
(F) Volcano plot highlighting key differentially expressed genes in CD45+ TILs from LLC-Vkine tumors compared with LLC-EV tumors. Genes whose overexpression has been linked to APC activation are shown in red and genes whose overexpression has been linked to T cell activation in green.
(G) Gene Ontology (GO) analysis of pathways enriched in CD45+ fractions from LLC-Vkine versus LLC-EV tumors.
ns, non-significant; *p < 0.05; **p < 0.01; ***p < 0.001; ****p < 0.0001. Data are presented as mean ± SEM. In vitro experiments were performed in technical triplicates. In vivo cohort sizes are shown in individual panels. All experiments were reproduced independently at least twice.
