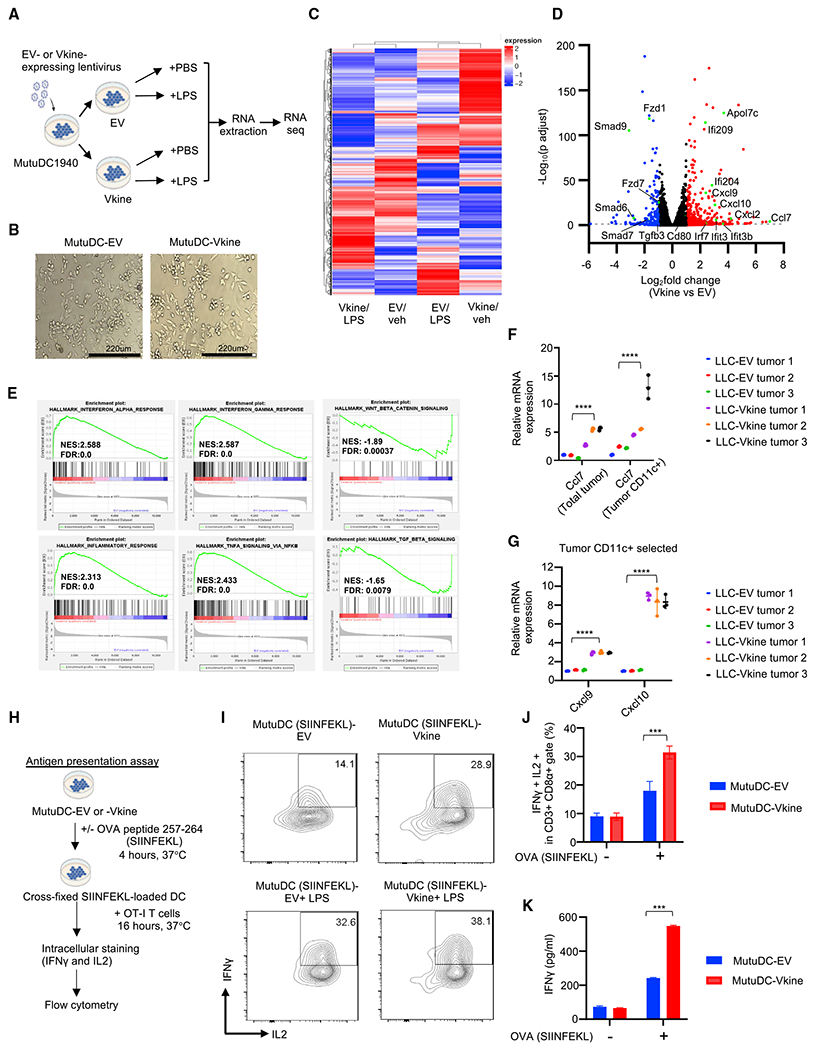
Figure 4. cDC1 activation by versikine is cell autonomous.

(A) Schematic layout of the experiment. MutuDC1940-EV or -Vkine cells were stimulated for 4 h with vehicle (PBS) or the TLR4 agonist lipopolysaccharide (LPS) (100 ng/mL) before RNA extraction.
(B) Gross morphology of MutuDC1940 cells engineered to express versikine (Vkine) or empty vector (EV). Phase contrast, 100× magnification; scale bar, 220 μm.
(C) Hierarchical clustering of MutuDC1940 transcriptomic profiles expressing EV or versikine (Vkine) and stimulated with the TLR4 agonist LPS or vehicle (PBS).
(D) Volcano plot highlighting key differentially expressed genes in MutuDC1940-Vkine versus -EV cells (without LPS).
(E) Gene set enrichment analysis (GSEA) of significantly upregulated (left and center) and downregulated (right) pathways in MutuDC1940-Vkine versus -EV cells (without LPS).
(F) Ccl7 RT-PCR using LLC-EV and LLC-Vkine tumor bulk mRNA (left) and CD11c+ magnetically separated fraction mRNA (right).
(G) Cxcl9 and Cxcl10 RT-PCR using CD11c+ magnetically separated fractions from LLC-EV or LLC-Vkine tumors.
(H) Schematic of the antigen presentation experiment.
(I) Flow cytometry for endogenous IFN-γ and IL-2 of OT-I CD8+ T cells co-cultured with SIINFEKL peptide-loaded MutuDC1940 cells, EV- or Vkine-expressing, with or without LPS.
(J) Quantitation of OT-I flow cytometry analysis of the antigen presentation assay.
(K) IFN-γ by ELISA in supernatants from OT-I and MutuDC1940:SIINFEKL co-cultures in the antigen presentation assay.
Data are presented as mean ± SEM. *p < 0.05, **p < 0.01, ***p < 0.001, ****p < 0.0001. In vitro experiments were performed in technical triplicates. In vivo cohort sizes are shown in individual panels. All experiments were reproduced independently at least twice.
