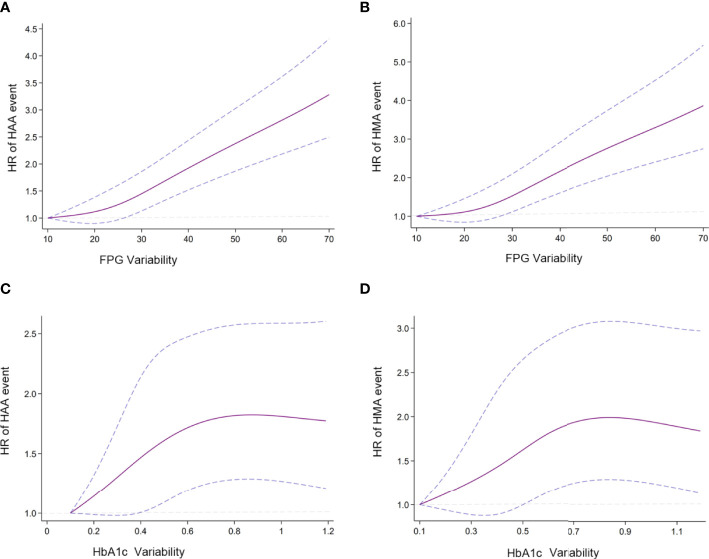
Figure 2.
Association of predicted HAA/HMA event and HbA1c/FPG variability (A) Association of FPG variability and HAA event; (B) Association of FPG variability and HMA event; (C) Association of HbA1c variability and HAA events; (D) Association of HbA1c variability and HMA event. Hazard ratios are indicated by solid lines and 95% CIs by areas between two dotted lines. (Reference point is the lowest value for each curve) The Reference knots were placed at the 5th, 35th, 65th, 95th, centiles of HbA1c/FPG variability distribution. HbA1c/FPG variability were adjusted using model 2.

