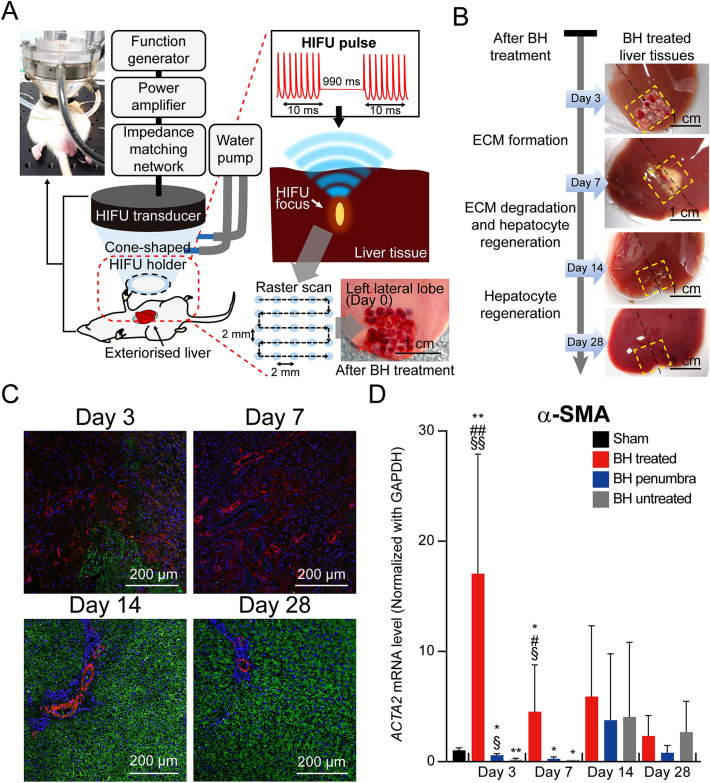
Figure 1.
Experimental method and regeneration of hepatocytes with degradation of fibroblasts after the BH treatment. (A) A schematic diagram of the experimental setup for performing boiling histotripsy in rat’s liver in vivo. The HIFU transducer was placed on the exteriorized liver tissue and a 10 ms-long HIFU pulse with a pulse repetition frequency of 10 Hz was used. The HIFU focus was moved by raster scan resulting in the production of a number of BH lesions in the liver over the area of 1.44 cm2 (1.2 cm × 1.2 cm). The photo of the in vivo experimental setup was adapted from Supplementary Fig. S5. The photo of the BH treated liver was adapted from Supplementary Fig. S1. (B) Morphological observation of the liver tissue on days 3, 7, 14 and 28 after the BH treatment. The yellow outlined boxes and black dot lines indicate BH-treated regions and cross section lines for histological observation. (C) Representative IHC staining images of fibroblasts and hepatocytes in the cross-sectioned BH-treated liver tissues. Hepatocytes were immunostained with Asgr1 antibody (green), and fibroblasts were immunostained with α-SMA antibody (red). Nuclei were counterstained with DAPI (blue). (Scale bar, 200 µm; magnification, 100 ×) (D) Expression mRNA levels of α-SMA. n = 5 for Sham, n = 3 for Day 3 and 7, n = 4 for Day 14, and n = 5 for Day 28. Data are presented as means ± standard deviation (SD) of individual values. One-way analysis of variance (ANOVA) followed by post-hoc Tukey’s test was used. §p < 0.05 vs. BH untreated of each time point, §§p < 0.01 vs. BH untreated of each time point, #p < 0.05 vs. BH penumbra of each time point, ##p < 0.01 vs. BH penumbra of each time point, *p < 0.05 vs. sham and *p < 0.01 vs. sham.

