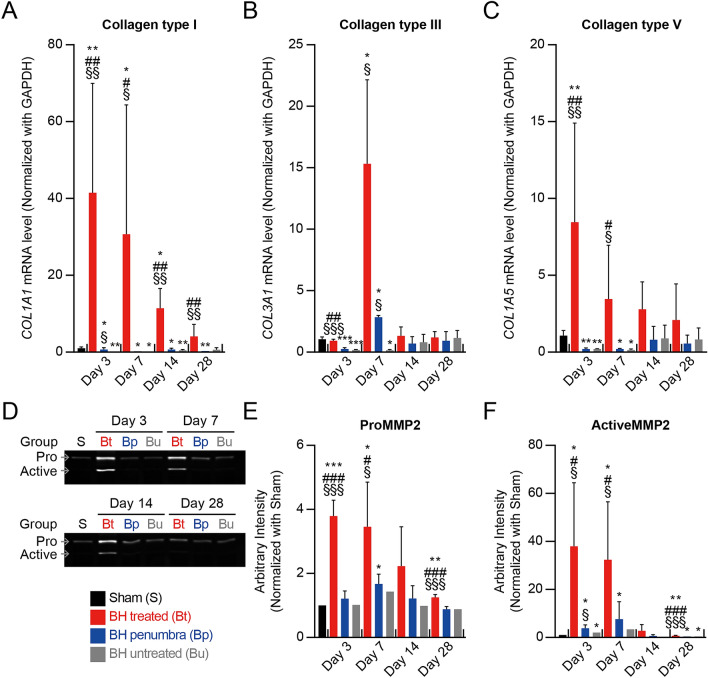
Figure 3.
Degradation of fibrillary collagens by active MMP-2. (A–C) Expression mRNA levels of collagen type I, III and V. n = 5 for Sham, n = 3 for Day 3 and 7, n = 4 for Day 14, and n = 5 for Day 28. (D) Representative image of MMP-2 gelatin acrylamide gel zymography. (E and F) Quantitative analysis of the relative levels of MMP-2 activity in liver lysates. n = 2 for Sham, n = 3 for Day 3, n = 4 for Day 7 and 14, and n = 5 for Day 28. Data are presented as means ± SD. One-way ANOVA followed by post-hoc Tukey’s test was used. §p < 0.05 vs. BH untreated of each time point, §§p < 0.01 vs. BH untreated of each time point, §§§p < 0.001 vs. BH untreated of each time point, #p < 0.05 vs. BH penumbra of each time point, ##p < 0.01 vs. BH penumbra of each time point, ###p < 0.001 vs. BH penumbra of each time, *p < 0.05 vs. sham, **p < 0.01 vs. sham and ***p < 0.001 vs. sham.

