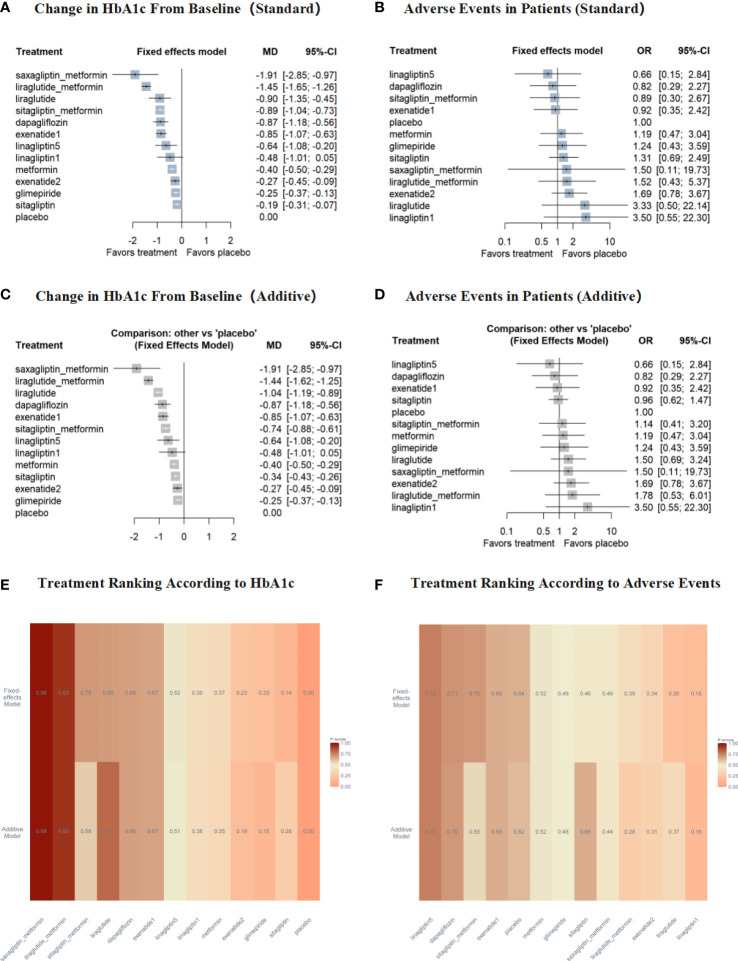
Figure 3.
Results for the primary outcomes compared with placebo. Treatments are presented according to their effect estimate compared with placebo. Effect sizes are presented as MD or OR with 95% CI's. MD, mean difference; OR, odds ratio. exenatide1, exenatide-2mcg; exenatide2, exenatide-5/10mcg; linagliptin1, linagliptin-1mg; linagliptin5, linagliptin-5mg. (A) the change in HbA1c from baseline of fixed effects model; (B) adverse events of patients of fixed effects model; (C) the change in HbA1c from baseline of additive model; (D) adverse events of patients of additive model; (E) treatment ranking according to HbA1c of both models; (F) treatment ranking according to adverse events of both models.

