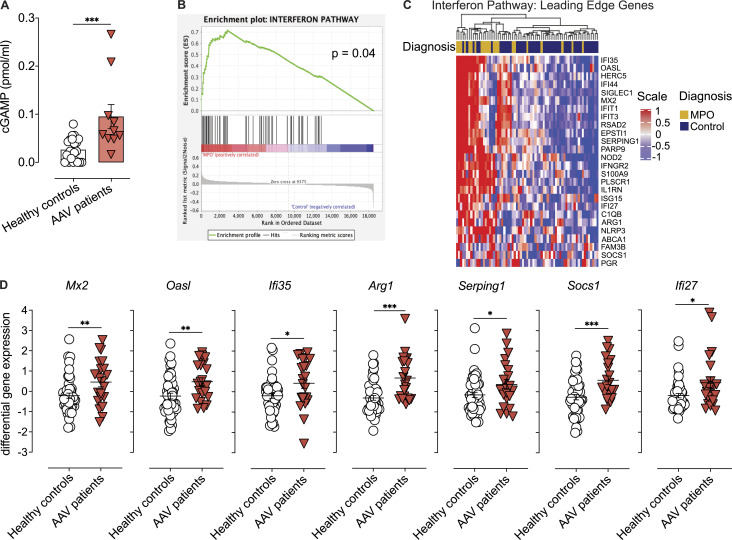
Figure 1.
Patients with ANCA-associated vasculitis show increased cGAS activation and IFN-I signature. (A) cGAMP concentration in PBMCs isolated from healthy donors or patients with active anti-MPO-associated vasculitis (patient cohort I; Table S1). Each dot is an individual donor (n = 22 for healthy, n = 10 for MPO-vasculitis donors). Columns represent mean ± SEM. (B) GSEA in patients undergoing active anti-MPO-associated vasculitis (n = 21, patient cohort II; Table S2). (C) Heatmap of IFN-I pathway leading-edge gene expression levels in patients with active anti-MPO-associated vasculitis (MPO, n = 21) or in remission (Control, n = 47; patient cohort II). (D) Expression levels for selected ISGs from analysis in C. Asterisks indicate the significance level of unpaired t test (A and D) and familywise-error rate (B) *, P < 0.05; **, P < 0.01; ***, P < 0.001.

