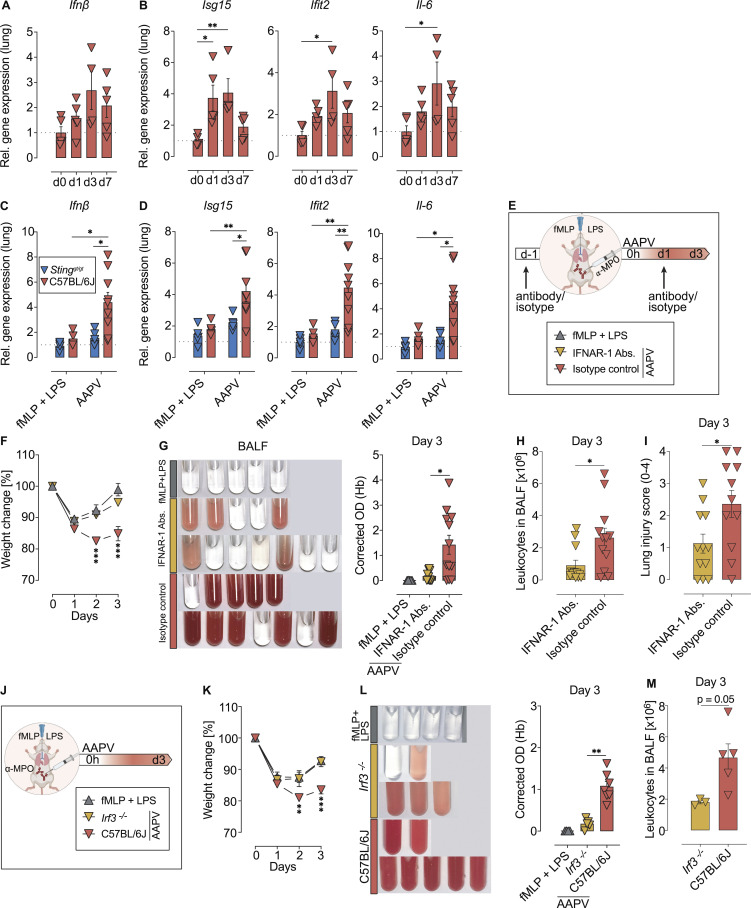
Figure 4.
IFNAR-1 and IRF3 promote severe anti-MPO-associated pulmonary vasculitis. (A–D) Relative expression of Ifnβ gene (A and C) and indicated ISGs (B and D) at different time points after AAPV induction in wild-type mice (A and B) or on day 3 in the indicated mice (C and D). Each dot is an individual mouse. Data are representative of two independent experiments (n = 4–9 mice/group). (E) Schematic representation of experiment with IFNAR-1 blocking antibodies. (F–I) Weight change (F), hemorrhages in BALF (G), leukocyte counts (H), and lung injury score (I) in wild-type mice treated as indicated. Each dot is an individual mouse. Shown are pooled results from two independent experiments (n = 5–12 mice/group). (J) Schematic representation of experiments with Irf3−/− mice. (K–M) Weight change (K), hemorrhages in BALF (L), and leukocyte counts (M) in wild-type and Irf3−/− mice treated as indicated. Each dot is an individual mouse. Shown are pooled results from two independent experiments (n = 3–7 mice/group) or a representative of two independent experiments (M, n = 3–5 mice/group). Bars and line graphs represent mean ± SEM. Asterisks indicate the significance level of unpaired t test (H, I, and M), one-way ANOVA with Dunnett’s multiple comparisons test (A and B) or Tukey’s multiple comparisons test (G and L) and two-way ANOVA with Šídák's multiple comparisons test (C, D, F, and K). *, P < 0.05; **, P < 0.01; ***, P < 0.001.

