Figure 5.
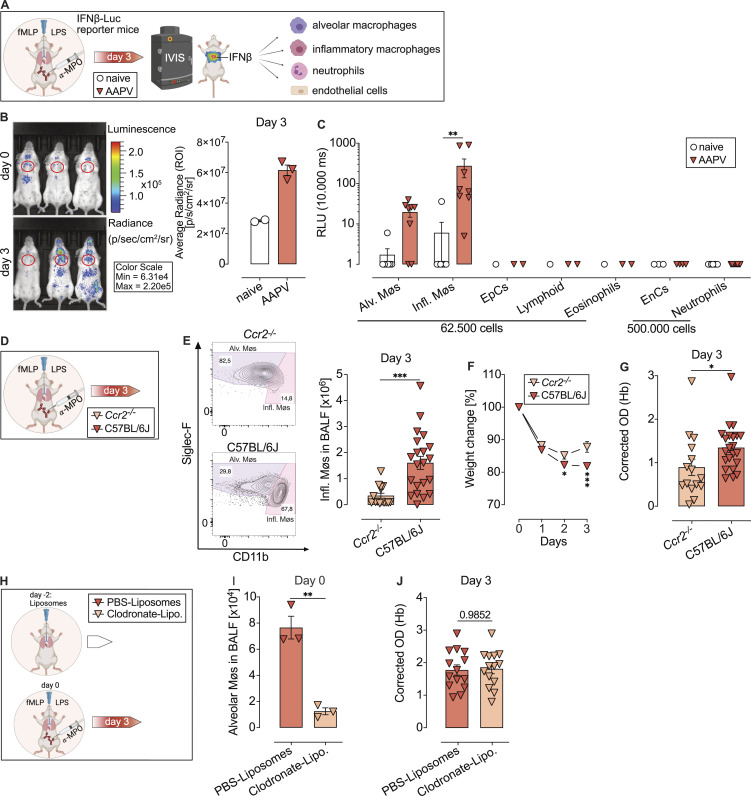
Infiltrating macrophages produce IFN-I and enhance severity of AAPV. (A) Schematic representation to measure Ifnβ promoter activity in reporter mice by in vivo and ex vivo bioluminescence imaging. (B) Representative photographs of Ifnβ-Luc reporter mice treated as indicated, and bioluminescence quantification of the region of interest (ROI, red gate). Quantification is pooled of two independent experiments (n = 2–3 mice/group). (C) Ex vivo bioluminescence quantification of FACS-sorted cell populations (gates in Fig. S2 and Fig. S4 A). Each dot represents cells from an individual mouse. Shown are data pooled from three independent experiments for alv. Møs, infl. Møs, EnC, neutrophils, and one experiment for the rest. Alv, alveolar; infl, infiltrating; Møs, macrophages; EpCs, epithelial cells; EnCs, endothelial cells. (D) Schematic representation of AAPV induction in mice. (E) Flow cytometric plot showing percentages of alv. and infl. Møs gated as in Fig. S2, and respective quantification. Shown are pooled data from two independent experiments (n = 15–22 mice/group). (F and G) Weight change (F) and hemorrhages in BALF (G) in indicated mice undergoing AAPV. Shown are pooled data from two independent experiments (n = 15–22 mice/group). (H) Schematics of treatment with liposomes before onset of AAPV. Lipo, liposomes. (I) Quantification of alv. Møs on the day of AAPV induction. Each dot represents an individual mouse from a representative of two independent experiments with n = 3 mice/group. (J) Quantification of hemorrhages in BALF at the peak of AAPV severity (day 3). Each dot represents an individual mouse from two pooled independent experiments with n = 14 mice/group. Bar and line graphs show mean ± SEM. Asterisks indicate the significance level of unpaired t test (E, G, and I), one-way ANOVA with Tukey’s multiple comparisons test (J) and two-way ANOVA with Šídák's multiple comparisons test (C and F) *, P < 0.05; **, P < 0.01; ***, P < 0.001.

