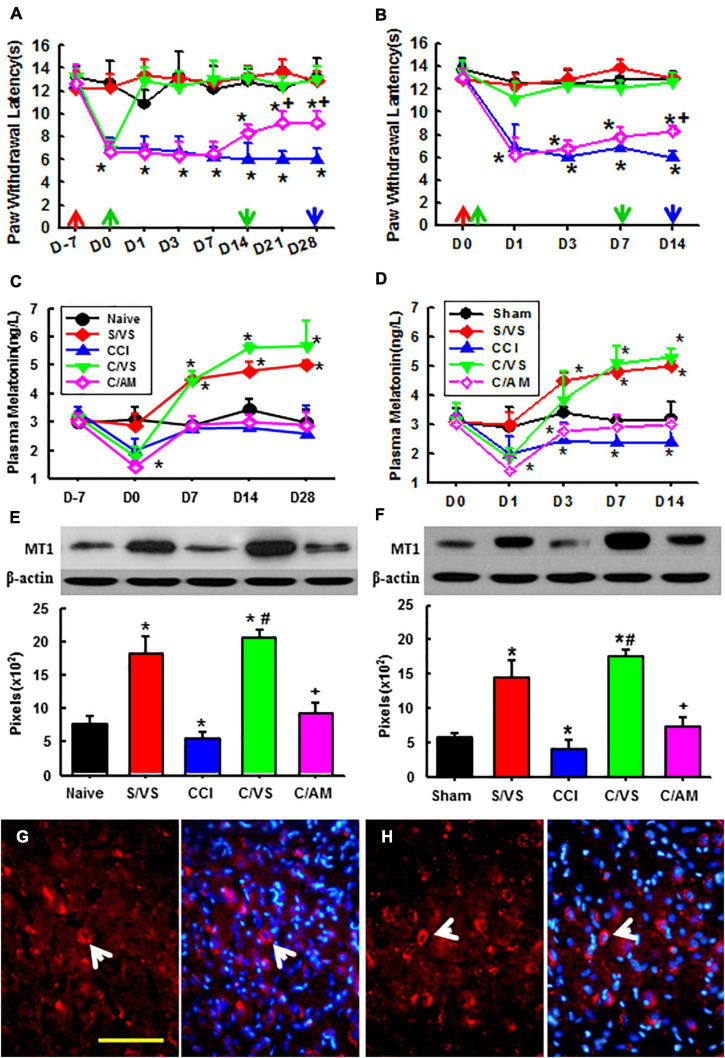
FIGURE 2.
Effects of taVNS on pain behavior, melatonin level, and MT1 expression. Showing the effect of taVNS on established (A) and developing (B) thermal hyperalgesia, corresponding plasma melatonin concentration (C,D), and MT1 protein expression at the last time point (E,F). D, day; red arrow, CCI or sham operation; the green up arrow, treatments start; the green down arrow, treatments end; the blue arrow, sacrifice; S/VS, CCI sham operation plus taVNS; CCI, sciatic nerve chronic constriction injury; C/VS, CCI + taVNS; C/AM, CCI + AMEA. *p < 0.05, as compared with naive or sham groups on the same day and the baseline of the same group; +p < 0.05 as compared with S/VS, CCI, and C/VS groups; and #p < 0.05 as compared with CCI and C/AM groups. (G) The MT1 positive neurons (the arrow) in the amygdala of ZDF rats, CCI treated with AMEA, on Day 28. (H) The MT1 positive neurons (the arrow) in the amygdala of the ZDF rats, CCI treated with taVNS, on Day 14. Bar, 100 μm.

