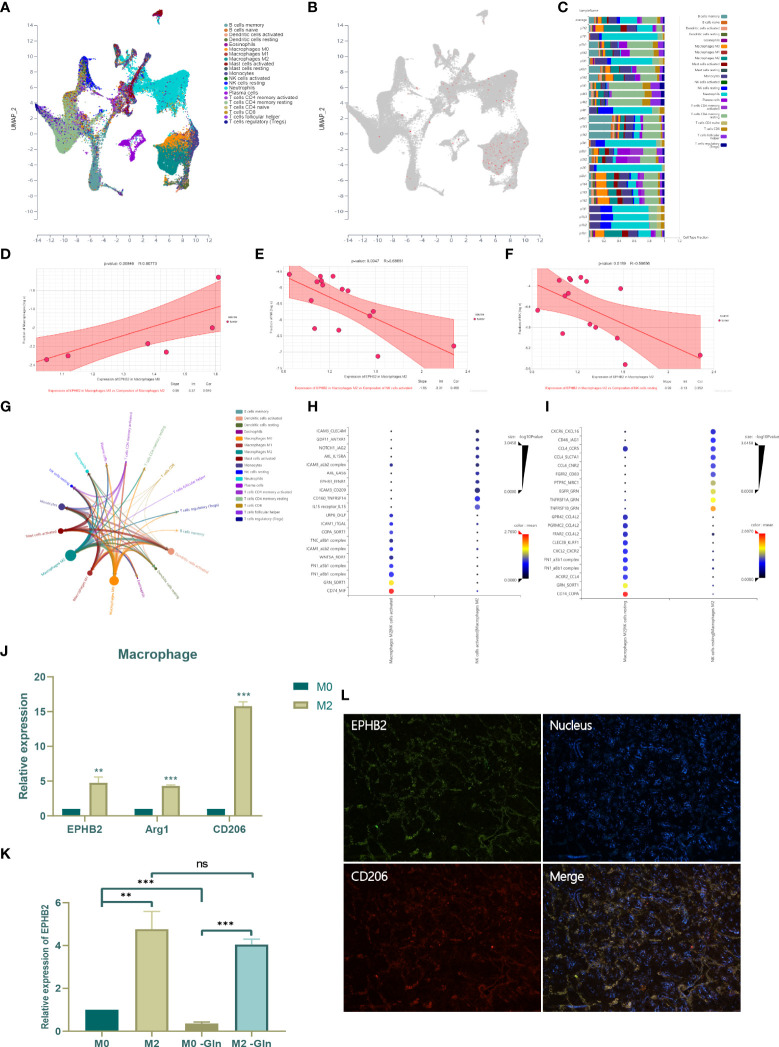
Figure 14.
Effect of EPHB2 on infiltrating immune cells of TME. (A) The distribution of immune cell clusters in UMAP plot. (B) The expression of EPHB2 in distinct clusters of immune cells. (C) Cell type fraction of each sample. (D) Correlation analysis between expression of EPHB2 in macrophages M0 and composition of infiltrating macrophages M2. Correlation analysis between expression of EPHB2 in macrophages M2 and composition of infiltrating activated NK cells (E) and resting NK cells (F). (G) Correlation network between tumor infiltrating immune cells. (H) The ligand-receptor interaction between macrophages M2 and activated NK cells. (I) The ligand-receptor interaction between macrophages M2 and resting NK cells. (J) Expression of EPHB2 and macrophages M2 markers in macrophages M0 and M2. (K) Expression of EPHB2 in normal macrophages M0, M2 and Gln-deprived macrophages M0, M2. (L) Co-localization between EPHB2 and CD206 detected by IF in LUAD specimen. “**” means that p < 0.01; "“***” means that p < 0.001; ns, no significance.

