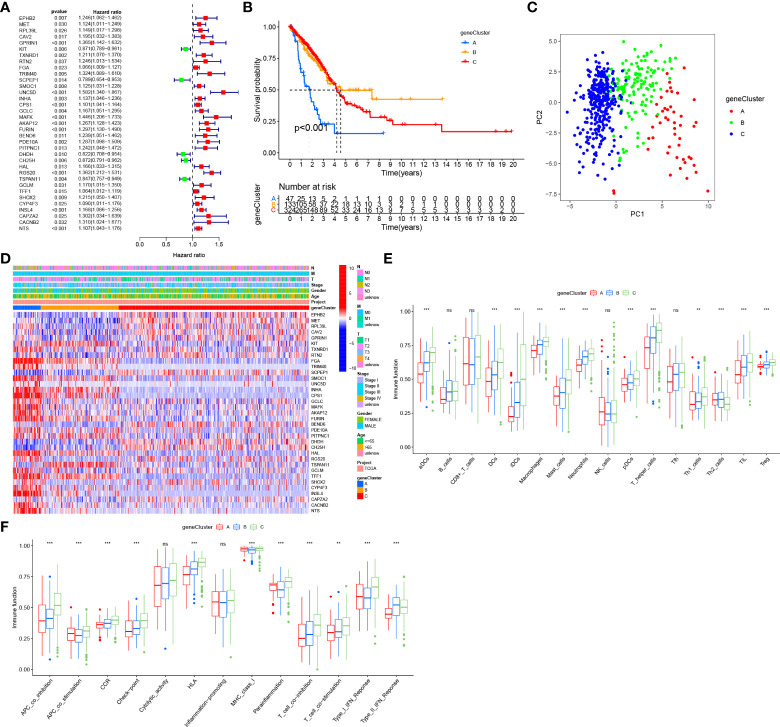
Figure 4.
Construction of gene clusters based on DEGs. (A) Univariate cox regression analysis of DEGs. (B) Survival analyses for the three gene clusters based on the prognosis-related DEGs. (C) PCA for the transcriptome profiles of three gene clusters. (D) Expression of prognosis-related DEGs in three gene clusters. (E) The abundance of tumor infiltrating immune cells in three gene clusters. (F) The difference of immune functions between three gene clusters. “**” means that p < 0.01; "“***” means that p < 0.001; ns, no significance.

