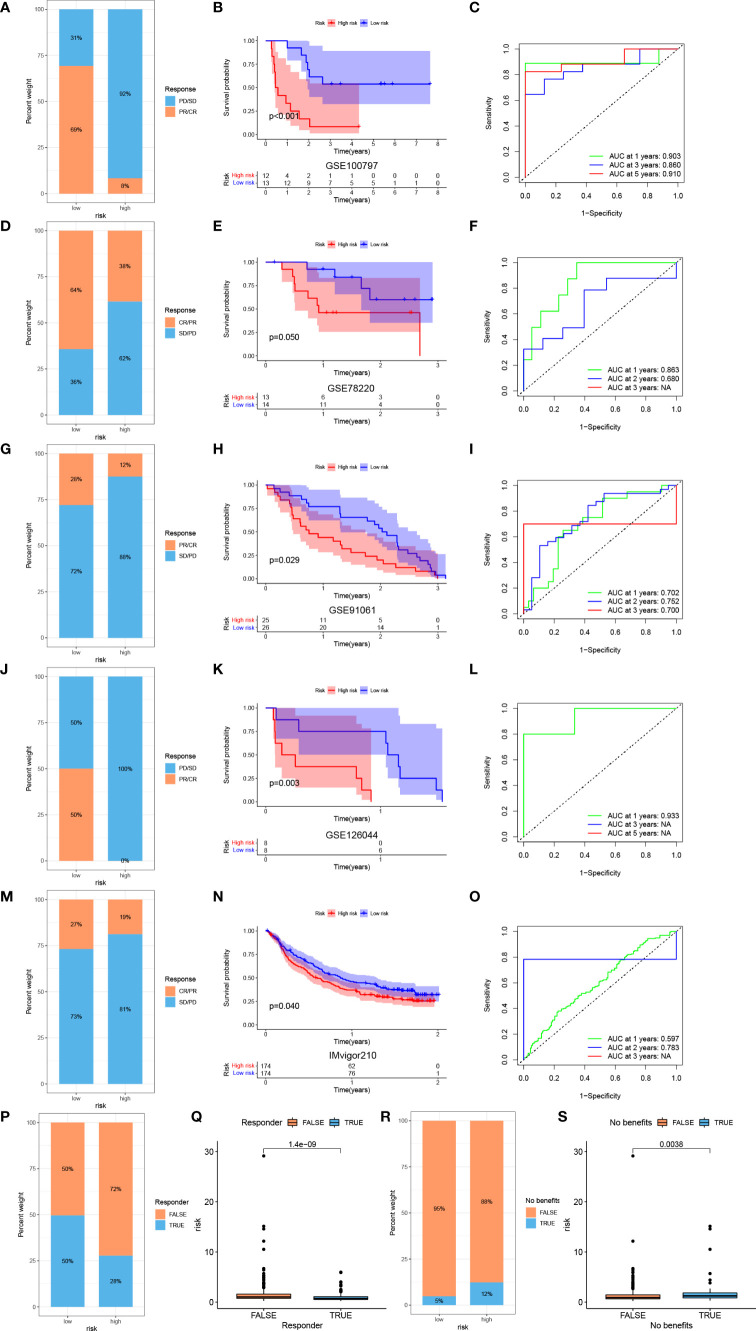
Figure 9.
Prediction of immunotherapy efficacy by the risk model. Response to ACT (A), survival analyses (B) and ROC curves of predicting prognosis (C) between low- and high-risk groups in melanoma cohort (GSE100797). Response to anti-PD-1 therapy (D), survival analyses (E) and ROC curves of predicting prognosis (F) between low- and high-risk groups in melanoma cohort (GSE78220). Response to anti-CTLA4 and ant-PD1 therapy (G), survival analyses (H) and ROC curves of predicting prognosis (I) between low- and high-risk groups in melanoma cohort (GSE91061). Response to anti-PD-1 therapy (J), survival analyses (K) and ROC curves of predicting prognosis (L) between low- and high-risk groups in NSCLC cohort (GSE126044). Response to anti-PD-L1 therapy (M), survival analyses (N) and ROC curves of predicting prognosis (O) between low- and high-risk groups in advanced urothelial cancer cohort (IMvigor210 cohort). (P) Difference of responder between low- and high-risk group of LUAD in TCGA. (Q) Difference of risk score between responder and non-responder of LUAD in TCGA. (R) Difference of benefits between low- and high-risk group of LUAD in TCGA. (S) Difference of risk score between benefit and no benefit of LUAD in TCGA.

