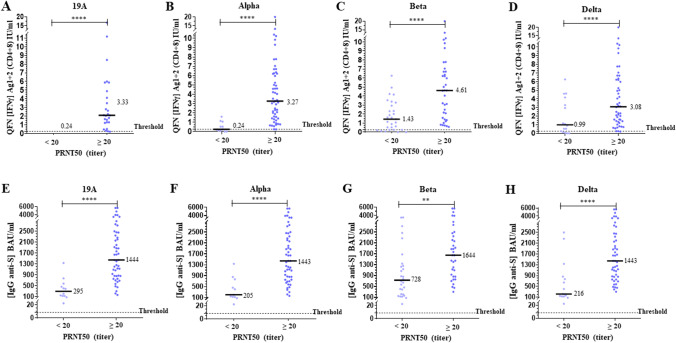
Fig. 2.
Comparison of neutralization, QFN, and anti-spike IgG in non-infected individuals after the second dose. The median of each subgroup is represented by a black line with the specified value. Positive threshold of each test is represented by a dotted line. A–D Plasmas samples were assayed for QuantiFERON SARS-CoV-2 Starter Set® (QFN) Ag1 + 2. Data show the concentration of IFNγ (IU/ml), and are expressed as dot plots, one dot corresponding to one patient, with a positive threshold at 0.25 IU/ml. E–H Sera were assayed for S (RBD)-specific IgG. Data show the concentration (BAU/ml) of immunoglobulins, and are expressed as dot plots, one dot corresponding to one patient. Positive threshold is 8.5 BAU/ml (supplier’s threshold). A–H All results are divided into 2 groups of corresponding neutralization titers (PRNT50), and according to each strain of virus tested, as indicated. Statistical significance is shown (Kruskal–Wallis’s test, ****p < 0.0001, ***p < 0.001, **p < 0.01, *p < 0.05)

