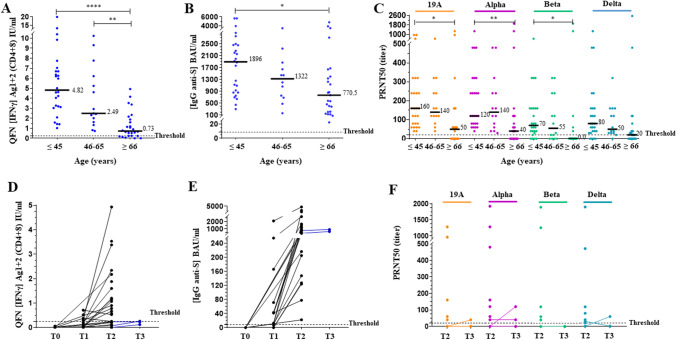
Fig. 4.
Elderly patients have a significantly lower vaccine response. The median of each subgroup is represented by a black line with the specified value. Positive threshold of each test is represented by a dotted line. A Plasmas samples were assayed for QuantiFERON SARS-CoV-2 Starter Set® (QFN) Ag1 + 2. Data show the concentration of IFNγ (IU/ml), and are expressed as dot plots, one dot corresponding to one patient, with a positive threshold at 0.25 IU/ml. B Sera were assayed for S (RBD)-specific IgG. Data show the concentration (BAU/ml) of immunoglobulins, and are expressed as dot plots, one dot corresponding to one patient. Positive threshold is 8.5 BAU/ml (supplier’s threshold). C Sera were assayed for their capacity to neutralize the infection of Vero E6 cells by different SARS-CoV-2 strains, as indicated. Data show the PRNT50 titer and are expressed as dot plots, one dot corresponding to one patient. Positive threshold corresponds to the limit of detection at 20. All results obtained 2–4 weeks after the second dose are divided into 3 groups of corresponding age, as indicated. D-F Evolution of the results of each test in elderly patients aged over 80 (n = 24) according to the number of doses received (T0, before vaccination; T1/T2/T3, 2–4 weeks after the first/second/third dose). Three patients had a third dose. Statistical significance is shown (Kruskal–Wallis’s test, ****p < 0.0001, ***p < 0.001, **p < 0.01, *p < 0.05)

