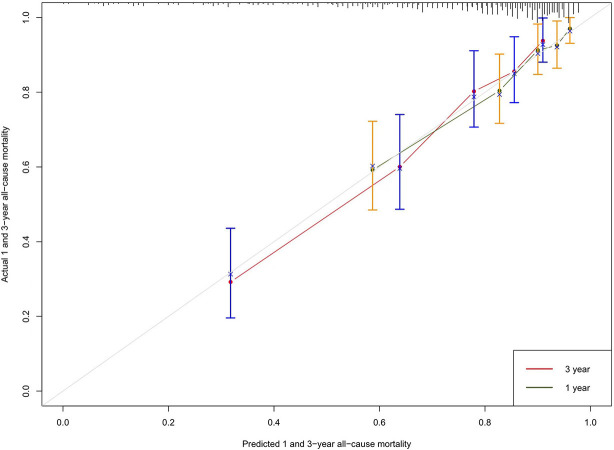
Figure 2.
Calibration curve: The abscissa is the predicted event rate, and the ordinate is the observed actual event rate, both ranging from 0 to 1, which can be understood as the event rate (percentage). The gray line of the diagonal is the reference line, i.e. the case where the predicted value = the actual value. The gray green and red curves represent the 1 - and 3-year model fit lines, respectively, and the two sides with color parts are 95% confidence interval.

