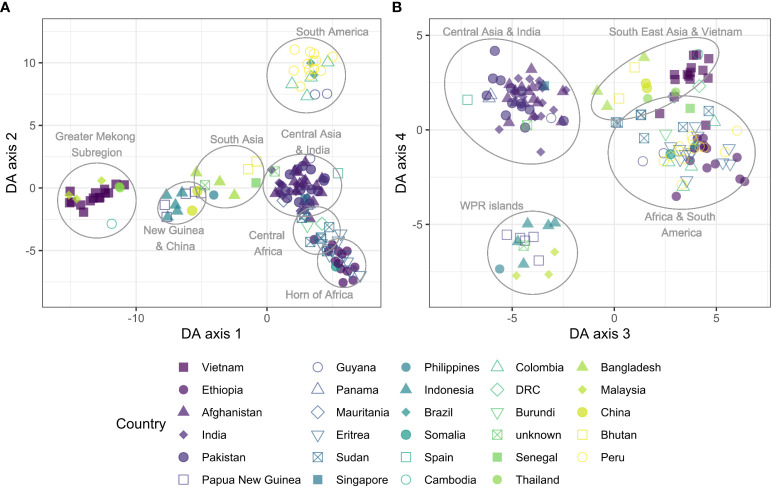
Figure 4.
Discriminant analysis of principal components (DAPC) of global isolates (n = 148), incl. 15 samples randomly selected from Vietnam. Scatter plot of discriminant analysis (DA) eigenvalues 1 and 2 (A) using all biallelic SNPs detected by the Pv AmpliSeq showed a differentiation from east to west from the Pacific into Asia along the x-axis and a separation between Africa and the Americas along the y-axis. Scatter plot of DA eigenvalues 3 and 4 (B) groups African and American samples together, close to South East Asian and Vietnam isolates and separately cluster the WPR islands and Central Asia and India. SNPs contributing most to the DAPC are listed in Supplementary Table 2 , Table S5 . DAPC was performed with 20 principal components and 20 discriminants as determined through cross-validation.

