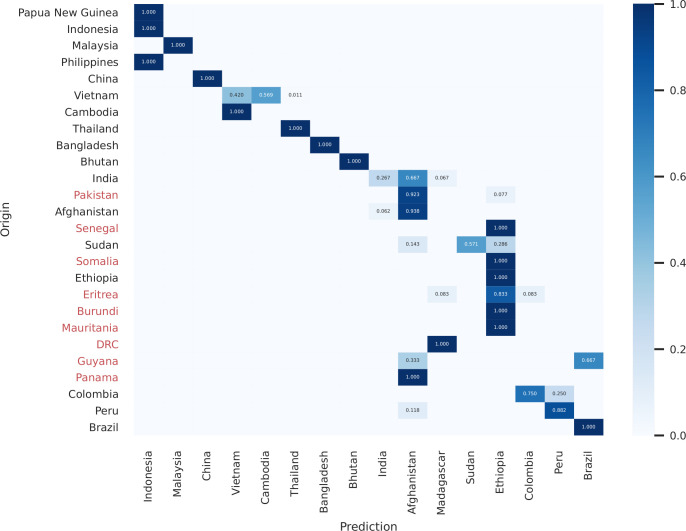
Figure 5.
Heatmap of predicted origin in the likelihood model vs. expected origin of samples based on collection site and travel history using the 72-SNP barcode. Predicted origin of the samples was calculated with the vivaxGEN-geo likelihood classifier (Trimarsanto et al., 2019). Countries of origin that were not represented in the reference dataset and hence could not be directly predicted are indicated in red on the origin axis; these countries can be included in future iterations of the classifier to improve its accuracy. Only samples from patients who presented in malaria-endemic countries are illustrated (i.e., excluding samples from Spain, Singapore and Unknown origin samples that were present in the larger dataset). The strong diagonal trend illustrates the regional accuracy of the predictor, with most infections mapping directly to the country of origin or to neighboring countries e.g., with Vietnamese samples mapping to either Vietnam or Cambodia. In border regions with extensive parasite gene flow, many infections may not be classifiable by national (political) boundaries, and regional boundaries may prove more useful administrative units for classification.

