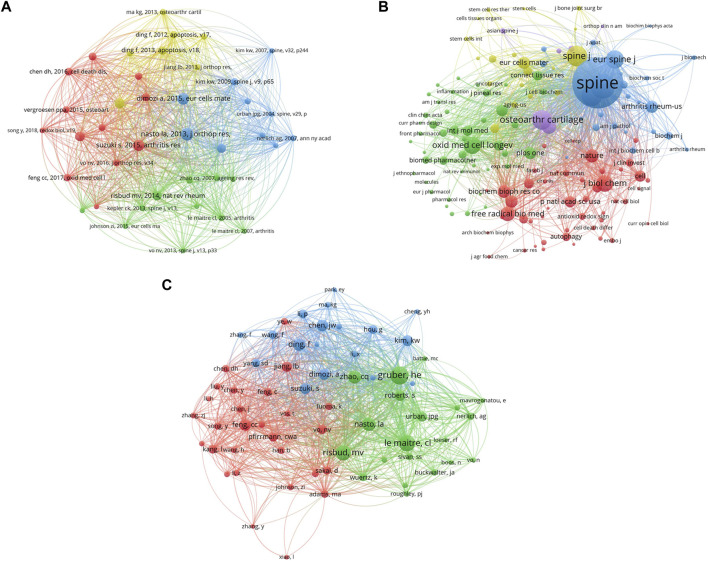
FIGURE 4.
The co-citation analysis of (A) references, (B) journals, and (C) authors on oxidative stress in intervertebral disc degeneration. (A point in the figure represents one reference, journal, and author, respectively. The color of the point represents different clusters, and the size of the point represents the number of citations for each reference, journal, and author, respectively. The more the number, the larger the point. The connection between the two points represents two papers are jointly cited by another paper, and the length of the connection between the two points represents the correlation between two articles. The shorter the line, the stronger the correlation.)

