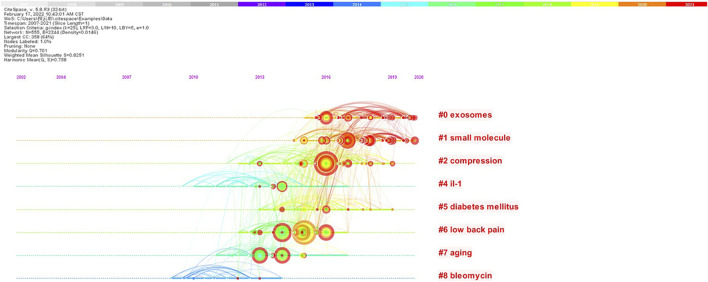
FIGURE 5.
Co-citation timeline of references by keywords on oxidative stress in intervertebral disc degeneration. (The nodes represent the references. The larger the node, the more citations the reference. The colors of the nodes from the inside to the outside correspond to color scale, which represents the total co-citations for the reference in the specific year. The line between two nodes represents two references co-citations. The thicker the line, the more the co-citations. The color of the connection line corresponds to the color mark above, which can reflect the time when two references were first co-cited.)

