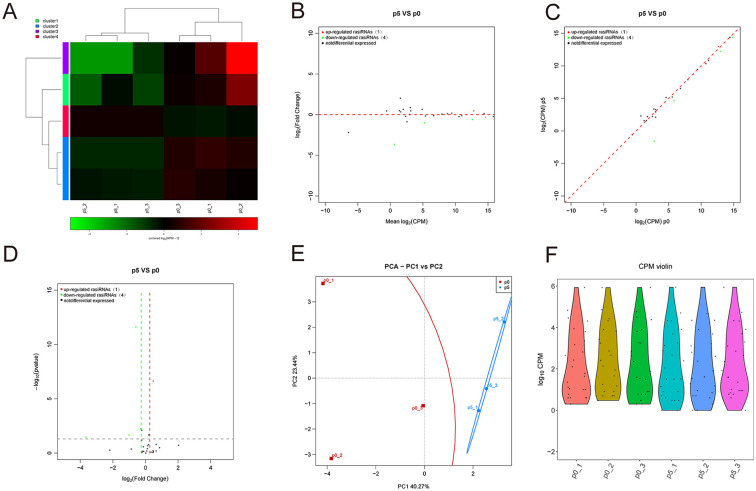
Figure 6.
Identification of differentially expressed rasiRNAs and tissue-specific analysis. (A) Heatmap showing the differentially expressed rasiRNAs between chondrocytes at passages 1 and 5. (B) MA showing the differentially expressed rasiRNAs between chondrocytes at passages 1 and 5. (C) Scatter plot showing the differentially expressed rasiRNAs between chondrocytes at passages 1 and 5. (D) Volcano plot showing the differentially expressed rasiRNAs between chondrocytes at passages 1 and 5. (E) Principal components analysis showing the differentially expressed rasiRNAs between chondrocytes at passages 1 and 5. (F) CPM violin plot showing the differentially expressed rasiRNAs between chondrocytes at passages 1 and 5. MA =Minus-Average, NC = Negative control, CPM = Count per million, PCA = Principle Component Analysis.

