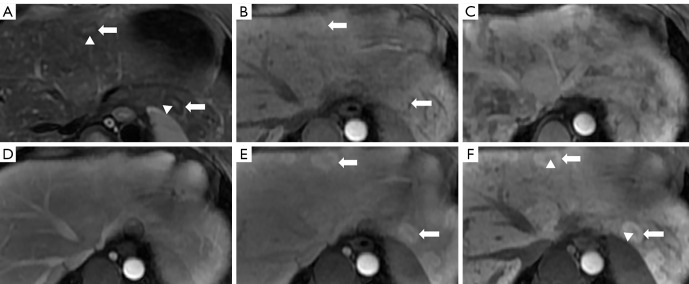
Figure 4.
Gd-EOB-DTPA enhanced MRI showed multiple hepatic nodules. The nodules (arrow) were slightly hypointense on T2 weighted image (A) and intensely enhanced on the early dynamic phase (C,D) and liver-specific phase (F). The central scar of nodules (arrowhead) were hyperintense on T2 weighted image (A) and hypointense on liver-specific phase (F). (A) T2 weighted image with fat saturation; (B) pre-contrast T1 spoiled gradient echo with fat saturation; (C) arterial phase; (D) portal venous phase; (E) transitional phase; (F) liver-specific phase. Gd-EOB-DTPA, gadolinium-ethoxybenzyl-diethylenetriamine pentaacetic acid; MRI, magnetic resonance imaging.

