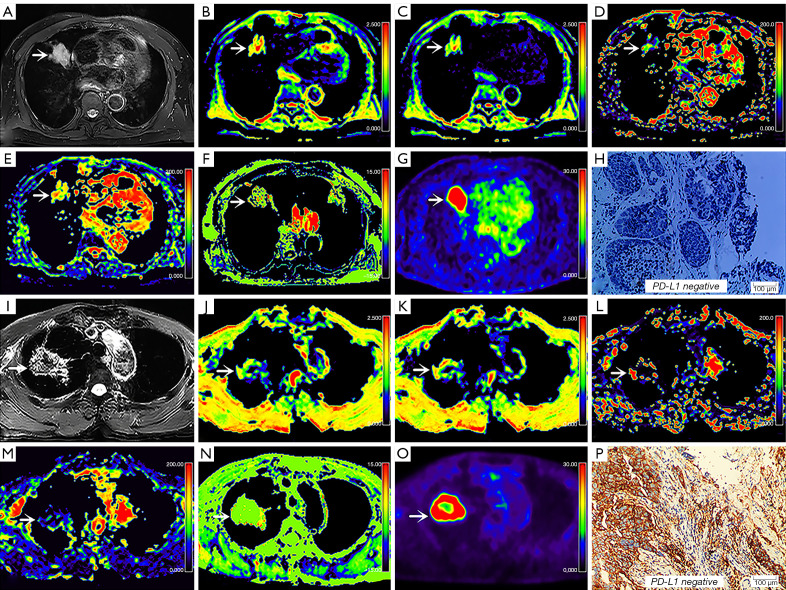
Figure 2.
Multiparametric PET-MRI images and immunohistochemistry images of different patients. (A-H) A 74-year-old man with squamous cell carcinoma (white arrow, smoker, maximum diameter 36 mm, grade III, stage IVA, PD-L1 negative, and TPS =0%). (I-P) A 73-year-old man with adenocarcinoma (white arrow, smoker, maximum diameter 38 mm, grade III, stage IVA, PD-L1 positive, and TPS =95%). (A,I) Maps of T2WI; (B,J) pseudocolored maps of ADC; (C,K) pseudocolored maps of D; (D,L) pseudocolored maps of D*; (E,M) pseudocolored maps of f; (F,N) pseudocolored maps of MTRasym (3.5 ppm); (G,O) pseudocolored maps of 18F-FDG PET; and (H,P) immunohistochemistry maps of PD-L1 expression (×200). PET-MRI, positron emission tomography/magnetic resonance imaging; PD-L1, programmed cell death-ligand; TPS, tumor proportion score; T2WI, T2-weighted imaging; ADC, apparent diffusion coefficient; D, diffusion coefficient; D*, pseudo diffusion coefficient; f, perfusion fraction; MTRasym (3.5 ppm), magnetization transfer ratio asymmetry at 3.5 ppm; 18F-FDG, 2-[18F]-fluoro-2-deoxy-D-glucose.

