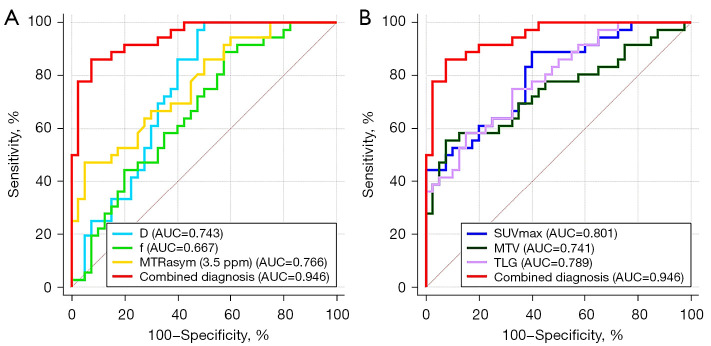
Figure 3.
ROC curves of different parameters. (A) ROC curves of D, f, MTRasym (3.5 ppm), and the combination of independent predictors. (B) ROC curves of SUVmax, MTV, TLG, and the combination of independent predictors. D, diffusion coefficient; f, perfusion fraction; MTRasym (3.5 ppm), magnetization transfer ratio asymmetry at 3.5 ppm; AUC, the area under the ROC curve; ROC, receiver operating characteristic; SUVmax, maximum standardized uptake value; MTV, metabolic tumor volume; TLG, total lesion glycolysis.

