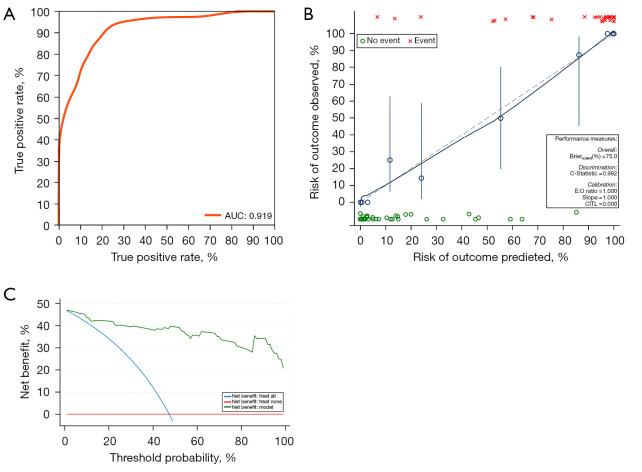
Figure 4.
Different curves for predicting PD-L1 expression status in the validation model. (A) ROC curves, (B) calibration curves, and (C) decision curve analysis. AUC, the area under the ROC curve; E:O, expected value: forecast value; CITL, intercept distance; PD-L1, programmed cell death-ligand; ROC, receiver operating characteristic.

