Figure 1.

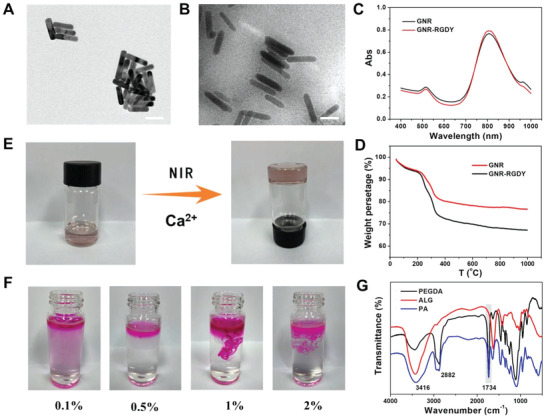
TEM images of A) GNR and B) GNR‐RGDY. C) UV–vis absorption spectra of GNR and GNR‐RGDY. Scale bar: 50 nm. D) TGA curves recorded for GNR (black) and GNR‐RGDY (red). The content of RGDY in was calculated by the weight loss from 200 to 1000 °C. E) Photographs showing the formation of GPA hydrogel. F) Photographs showing the gelation performance of ALG at different concentrations (0.1, 0.5, 1, and 2 wt%) after injection into Ca2+ containing PBS. G) FTIR spectra of PEGDA, ALG, and PA hydrogels.
