
Figure 3.
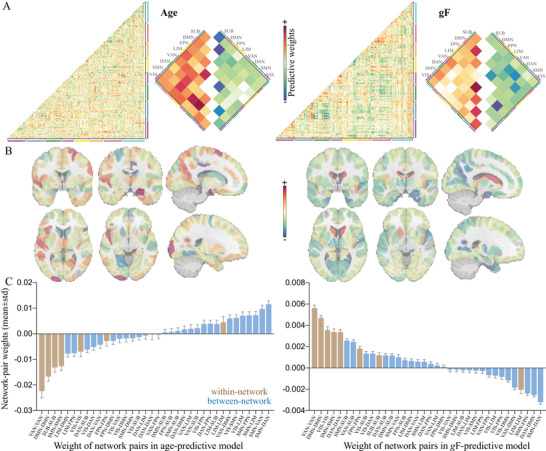
Distributions of weight maps in predicting age and fluid intelligence. A) Distributions of raw predictive weights averaged across 2000 cross‐validation rounds. The cell plots show the network‐level representation of the predictive weights. For each pair of networks (between‐network and within‐network), we averaged predictive weights of all connections belonging to that network pair. Positive weights and negative weights were separately summarized for each network pair to demonstrate their relative contribution. B) Distributions of weight maps at the node level. The node‐level representation was achieved by summarizing weight values of all connections incident to each of the 246 atlas‐defined functional macroscale regions. C) Mean weights distribution of within‐network and between‐network connections in age‐ and gF‐predictive models. Error bars indicate standard deviation. DAN, dorsal attention network; DMN, default mode network; FPN, frontoparietal network; gF, fluid intelligence; LIM, limbic network; SMN, somatomotor network; SUB, subcortical network; VAN, ventral attention network; VIS, visual network; VSTM, visual short‐term memory.