
Fig. 3.
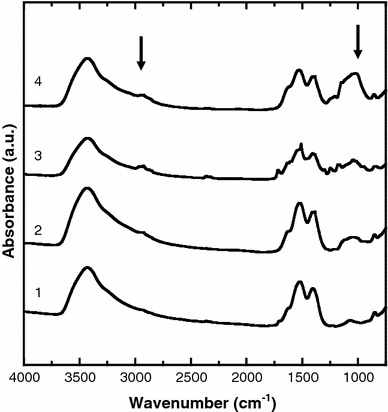
FTIR spectra of (1) Er-Y2O3, (2) APTES–Er–Y2O3, (3 and 4) PEG–Er-doped Y2O3 nanoparticles (3, 1.0 ng/mL; 4, 30 μg/mL NHS-PEG concentration used for the modification). Arrows indicates peaks at 2,900 and 1,100 cm−1 (see text for details)
Official websites use .gov
A
.gov website belongs to an official
government organization in the United States.
Secure .gov websites use HTTPS
A lock (
) or https:// means you've safely
connected to the .gov website. Share sensitive
information only on official, secure websites.
FTIR spectra of (1) Er-Y2O3, (2) APTES–Er–Y2O3, (3 and 4) PEG–Er-doped Y2O3 nanoparticles (3, 1.0 ng/mL; 4, 30 μg/mL NHS-PEG concentration used for the modification). Arrows indicates peaks at 2,900 and 1,100 cm−1 (see text for details)