FIGURE 4.
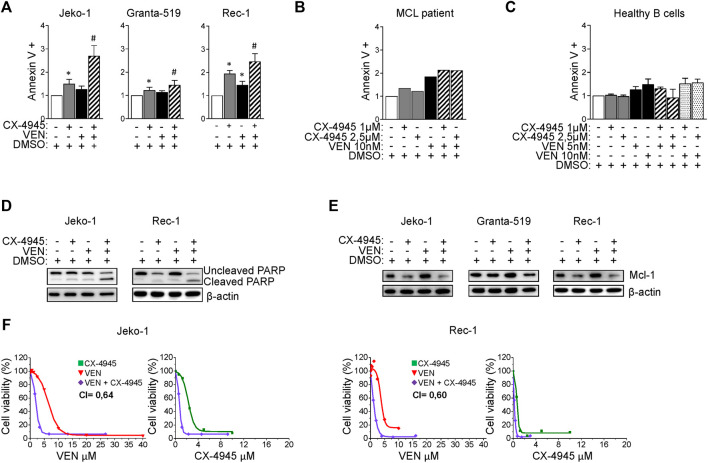
CX-4945 potentiates Venetoclax induced cytotoxicity. (A) Histograms depicting the percentage of Annexin V positive Jeko-1, Granta-519 and Rec-1 cells after 24 h treatment with DMSO (not higher than 0.1% v/v; white columns), CX-4945 (1 μM for Jeko-1 and Granta-519, 0.5 μM for Rec-1; grey columns), VEN (20 nM for Jeko-1, 1.25 nM for Granta-519 and 50 nM for Rec-1; black columns) or their combination (striped columns). Data are expressed as ratio over DMSO treated cells, mean ± SD of n = 10 (Jeko-1), n = 9 (Granta-519) and n = 6 (Rec-1) independent experiments. * indicates p < 0.05 compared to DMSO treated cells; # indicates p < 0.05 compared to both CX-4945 and VEN only treated cells. (B) Histogram showing the percentage of Annexin V positive B cells derived from one MCL patient after 24 h treatment with DMSO (not higher than 0.1% v/v; white column), CX-4945 (1 μM and 2.5 μM; grey columns), VEN (10 nM; black column) or their combination (striped columns). Data are expressed as ratio over DMSO treated cells. (C) Histogram showing the percentage of Annexin V positive healthy B cells treated for 24 h with DMSO (not higher 0.1% v/v; white column), CX-4945 (1 μM and 2.5 μM; grey columns), VEN (5 and 10 nM; black columns) or their combination (striped and dotted colums). Data are normalized on DMSO treated cells and are expressed as the mean ± SD of n = 3 independent experiments. (D) Representative WB showing the expression levels of uncleaved and cleaved PARP in Jeko-1 and Rec-1 cells treated as in (A). β-actin was used as loading control. Experiments were repeated at least three times for each cell line. (E) Representative WB showing the expression levels of Mcl-1 in Jeko-1, Granta-519 and Rec-1 cells treated as in (A). β-actin was used as loading control. Experiments were repeated at least three times for each cell line. (F) Dose response curves of Jeko-1 and Rec-1 cells incubated for 72 h with increasing concentrations of CX4945 (green curves), VEN (red curves) or their combination (purple curves). For Jeko-1, IC50 of the single treatments were 2.30 μM for CX4945 and 6.68 μM for VEN. IC50 for CX4945 used in combination with VEN was 0.74 μM, while IC50 for VEN used in association with CX-4945 was 2.13 μM. The calculated CI was 0.64. For Rec-1, IC50 of the single treatments were 0.76 μM for CX-4945 and 4.0 μM for VEN. IC50 for CX-4945 used in combination with VEN was 0.23 μM, while IC50 for VEN used in association with CX-4945 was 1.22 μM. The calculated CI was 0.60. Data are presented as averaged percentage over control of three independent experiments for each cell line.

