FIGURE 5.
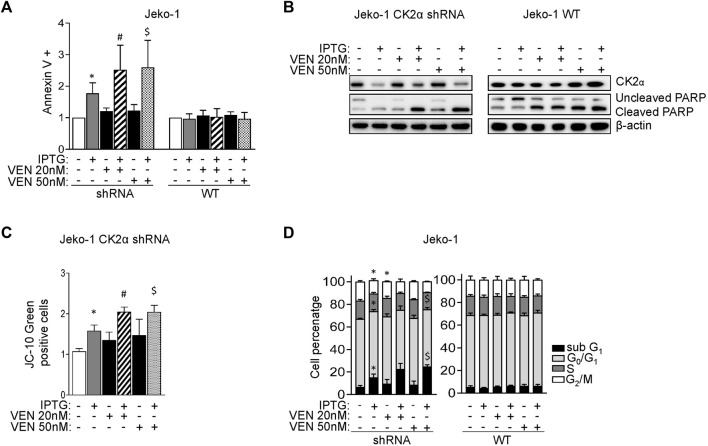
CK2α silencing potentiates the cytotoxic and cytostatic effects induced by Venetoclax. (A) Histogram showing the percentage of Annexin V positive Jeko-1 CK2α shRNA and Jeko-1 WT cells after 6 days of CK2α silencing with IPTG 500 μM (grey columns), 24 h treatment with VEN 20 and 50 nM (black columns) or their combination (striped and dotted columns). Data are expressed as ratio over untreated cells, mean ± SD of n = 12 independent experiments for each cell line. * indicates p < 0.05 compared to untreated cells; # indicates p < 0.05 compared to both IPTG and VEN 20 nM only treated cells; $ indicates p < 0.05 compared to both IPTG and VEN 50 nM only treated cells. (B) Representative WB showing the expression levels of uncleaved and cleaved PARP in Jeko-1 CK2α shRNA and Jeko-1 WT cells treated as in (A). β-actin was used as loading control. Experiments were repeated at least three times for each cell line. (C) Histogram depicting the percentage of JC-10 green positive Jeko-1 CK2α shRNA cells treated as in (A). Data are expressed as ratio over averaged untreated cells, mean ± SD of n = 3 independent experiments. * indicates p < 0.05 compared to untreated cells; # indicates p < 0.05 compared to both IPTG and VEN 20 nM only treated cells; $ indicates p < 0.05 compared to both IPTG and VEN 50 nM only treated cells. (D) Cell cycle distribution of Jeko-1 CK2α shRNA and Jeko-1 WT cells treated as in (A). Histograms columns sections represent mean ± SD of n = 4 (Jeko-1 CK2α shRNA) and n = 6 (Jeko-1 WT) independent experiments of the sub G1 (black), G₀/G₁ (light grey), S (dark grey) and G₂/M (white) cell cycle phases. * indicates p < 0.05 compared to untreated cells; $ indicates p < 0.05 compared to both IPTG and VEN 50 nM only treated cells.

