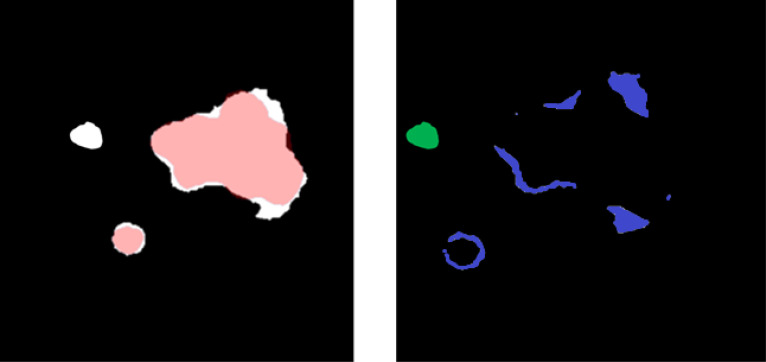
Figure 5.
(Left) Overlay between predicted (white) and ground-truth (red) disease segmentations. (Right) Subtraction of the predicted and ground-truth disease segmentation and over-segmentation of the disease volume (blue) and unconnected erroneous false-positive region (green). The sum of blue and green is a false-positive volume.

