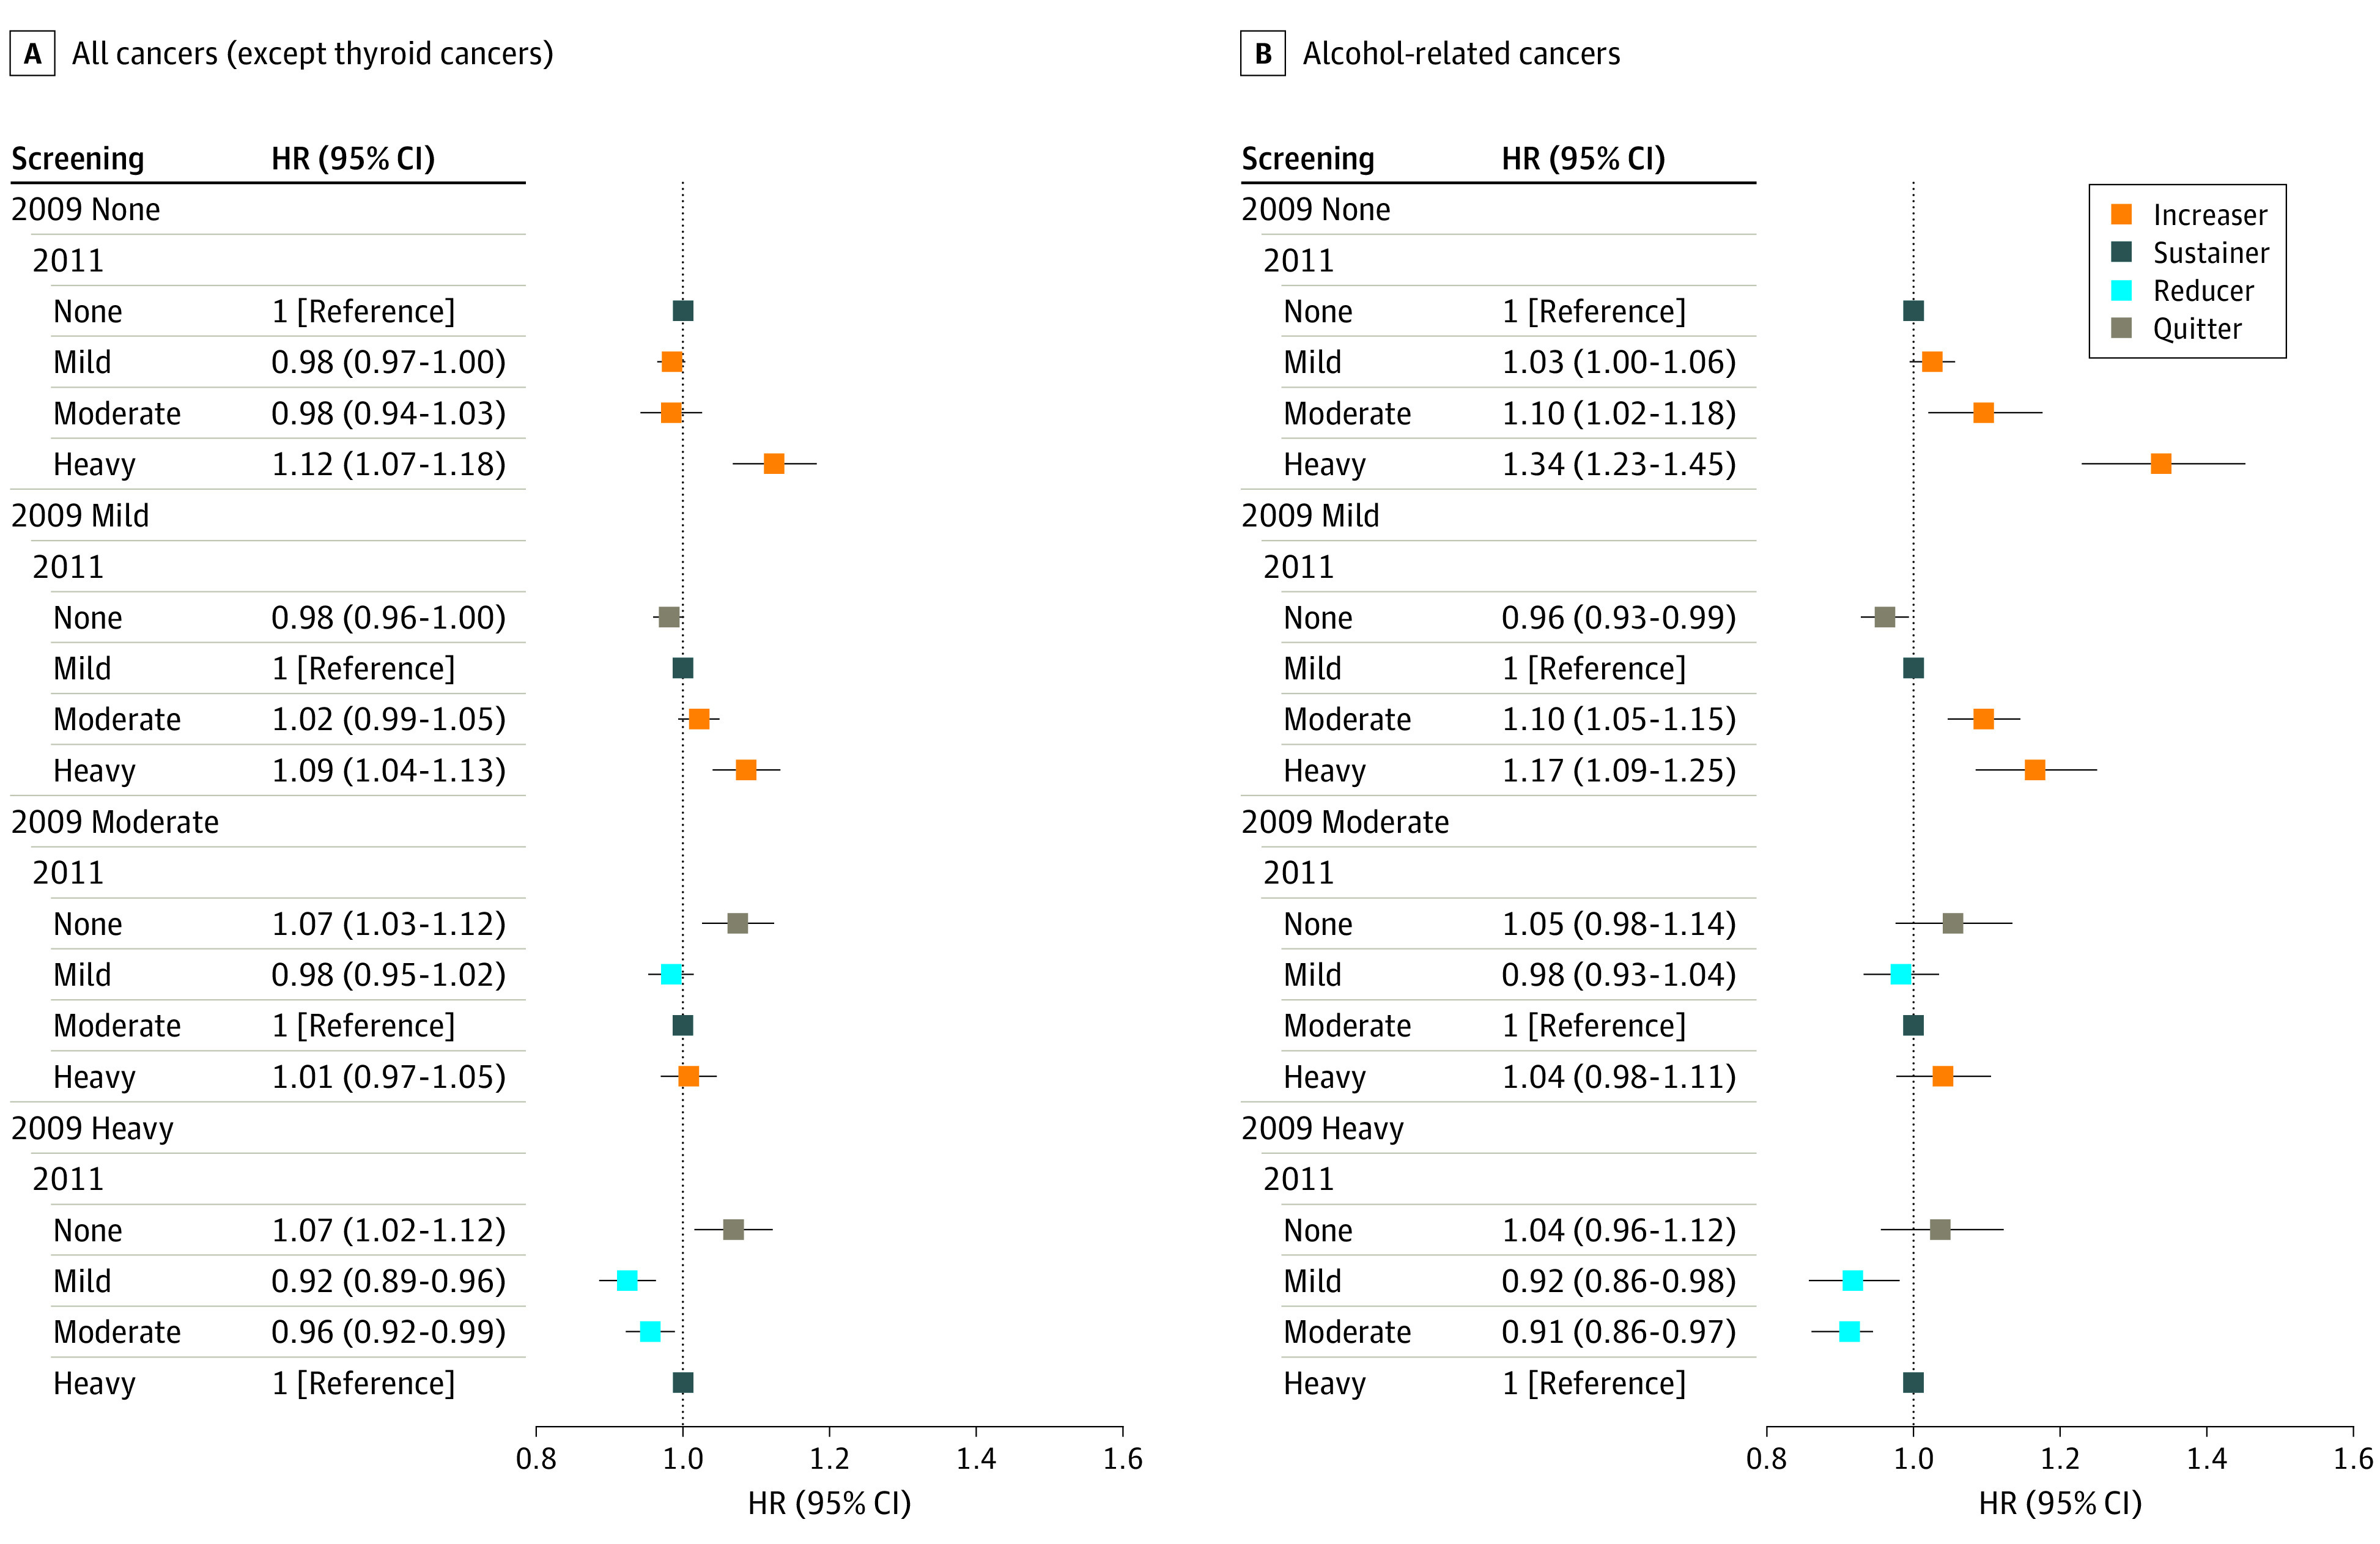
Figure 1. Risk of All Cancers and Alcohol-Related Cancers by Changes in Drinking Level Between 2009 and 2011.

Hazard ratios (HRs) were adjusted for age, sex, socioeconomic position (income level and place of residence), smoking status, physical activity, comorbidities (hypertension, diabetes, dyslipidemia, chronic kidney disease, chronic obstructive pulmonary disease), and Charlson Comorbidity Index. Error bars indicate the 95% CIs.
