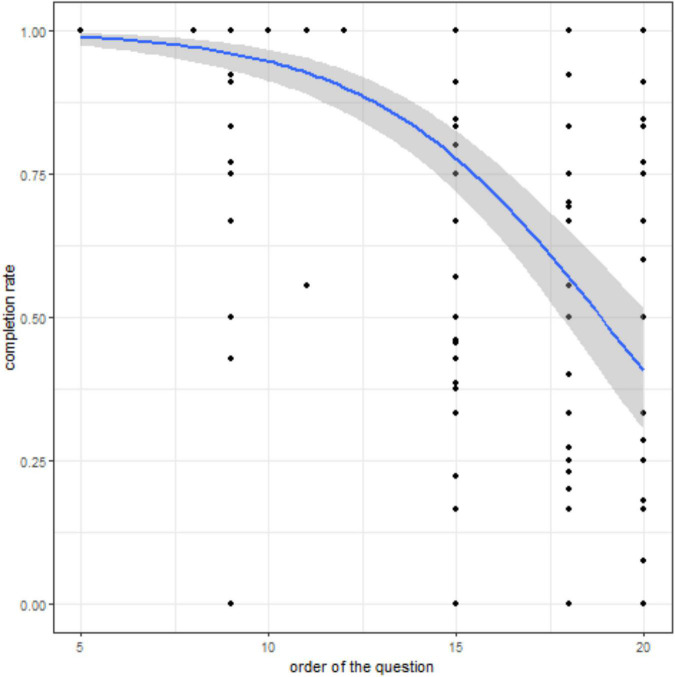
FIGURE 4.
Completion rate according to the question position in the daily EMA. Relationship between the question ranking in the daily EMAs and the completion rate. The predicted probability (blue curve) from the logistic mixed model and its 95% CI (shaded area) are shown. Black dots indicate the completion rate for each patient (n = 45) and each question asked but not necessarily answered.

