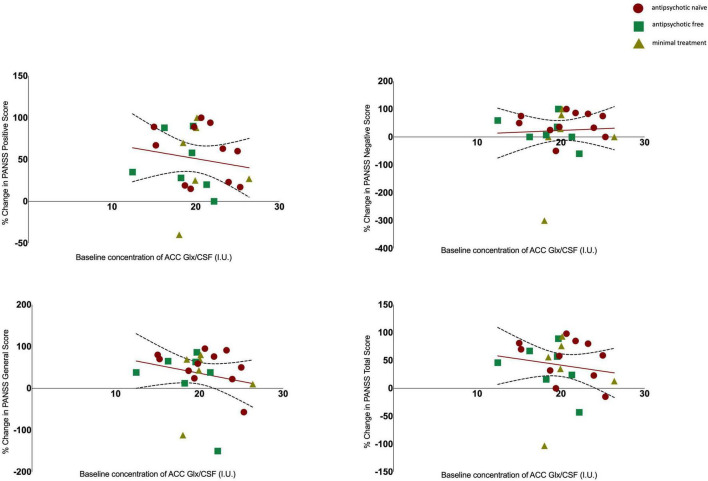
FIGURE 3.
Relationship between Glx levels and the percentage change in PANSS positive (r = −0.152, p = 0.477), negative (r = 0.052, p = 0.811), general (r = −0.212, p = 0.320) and total scores (r = −0.155, p = 0.470) with 95% confidence intervals derived from the line of best fit. Individuals are stratified by medication status, antipsychotic naïve (circle), antipsychotic free (square), minimal treatment (triangle).

