
Figure 5. Mo-AMs have distinct phenotype characterized by upregulation of type 2 markers.
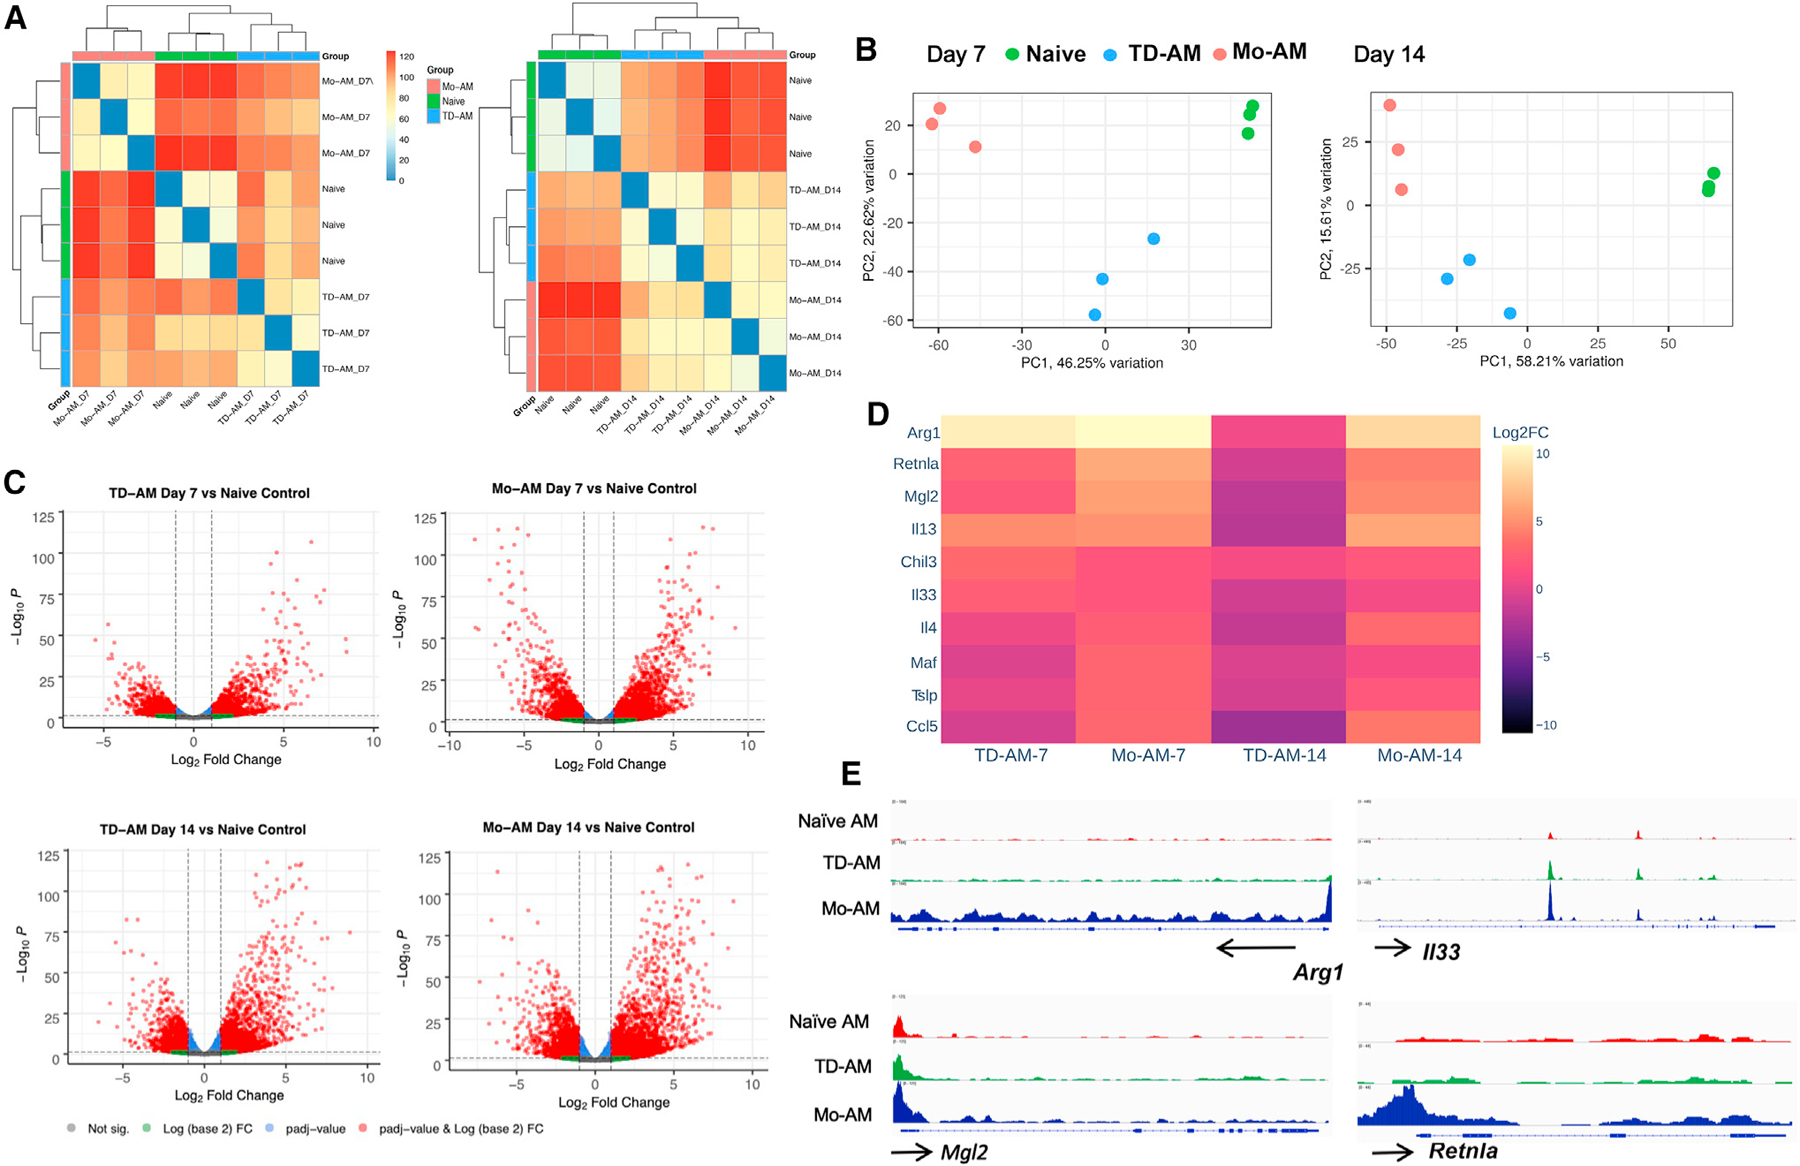
(A–E) Cx3cr1CreERT2-IRES-YFP/+Rosa26floxed-tdTomato/+ reporter mice received TAM at days −1 and +1 after Nb infection. At days 7 and 14, tdT+ Mo-AMs and tdT− tissue-derived AMs (TD-AMs) were sort-purified for RNA-seq transcriptional analysis and compared with naive AMs, with 3 mice/treatment group.
(A) Pairwise Euclidean distance relative to the transcriptional profiles, demonstrating sample relatedness between AMs from untreated mice, and Mo-AMs and TD-AMs at days 7 and 14 after Nb inoculation.
(B) Principal-component analysis of transcriptional profiles of treatment groups.
(C) Volcano plots of TD-AMs and Mo-AMs individual gene expression profiles at days 7 and 14 expressed relative to AMs from naive mice.
(D) Expression of selected characteristic type 2 response markers in TD-AMs and Mo-AMs at days 7 and 14 after Nb inoculation as expressed relative to AMs from naive mice (log2 fold change).
(E) Genome browser views of Arg1, II33, Mgl2, and Retnla in naive AMs, TD-AMs, and Mo-AMs. Each track represents the normalized read counts of accessible chromatin regions.
See also Figures S2 and S3