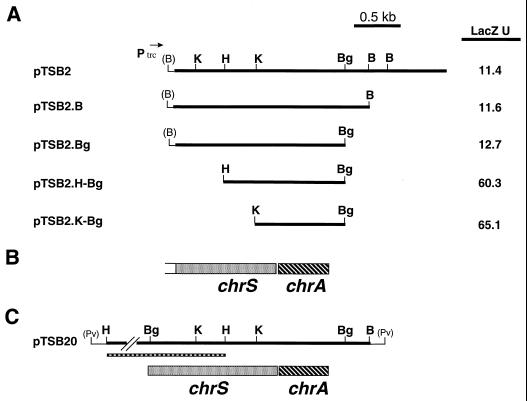
FIG. 2.
(A) Restriction maps of plasmid pTSB2 and various subclones. The direction of transcription from the plasmid-encoded trc promoter is indicated by the arrow. LacZ assays were done with E. coli DH5α/pCPO-1 that carried the various activator clones. Bacteria were grown in LB medium in the presence of 0.5 mM IPTG, and LacZ units were determined by the method of Miller (27). Values are means of three independent experiments, and standard deviations did not vary by greater than 15% from the mean. (B) Genetic map of the chrS and chrA genes present on plasmid pTSB2. The genetic map is aligned with the restriction maps shown in panel A. (C) Restriction and genetic maps of plasmid pTSB20. The thin boxed region below the restriction map indicates the location of the 1.5-kb HindIII fragment that is present in plasmid pKSH51 and contains the 5′ portion of the chrS gene. Only a portion of the HindIII fragment is shown. The restriction and genetic maps are aligned with each other and with the maps shown in panels A and B. Restriction sites are as follows: B, BamHI; Bg, BglII; H, HindIII; K, KpnI; Pv, PvuII. Sites shown in parentheses indicate restriction sites present in vector sequences.

