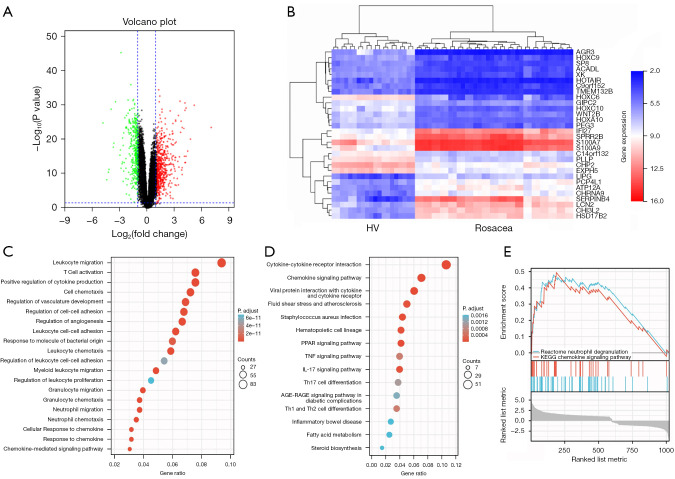
Figure 1.
Identification and functional annotation of the differentially expressed genes between rosacea tissues and healthy controls. (A) A volcano plot showing the upregulated DEGs (red dots) and downregulated DEGs (green dots) of rosacea tissues compared with healthy controls. (B) A hierarchical clustering heatmap showing the predominant differentially expressed mRNAs and lncRNAs of rosacea tissues compared with healthy controls. The expression of S100A9 was significantly upregulated. (C) A bubble plot showing the enrichment of the candidate DEGs by GO analysis. (D) A bubble plot showing the enrichment of the candidate DEGs by KEGG analysis. (E) The enrichment score ranking of the DEGs by GSEA. The pathways with the highest enrichment scores were neutrophil degranulation and the chemokine signaling pathway. HV, healthy volunteers; PPAR, peroxisome proliferator activated receptors; TNF, tumor necrosis factor; IL-17, interleukin-17; Th17, T helper cell 17; Th1 cell, T helper cell 1; Th2 cell, T helper cell 2; DEG, differentially expressed genes; mRNA, messenger RNA; lncRNA, long non-coding RNA; GO, Gene Ontology; KEGG, Kyoto Encyclopedia of Genes and Genomes; GSEA, Gene Set Enrichment Analysis.

