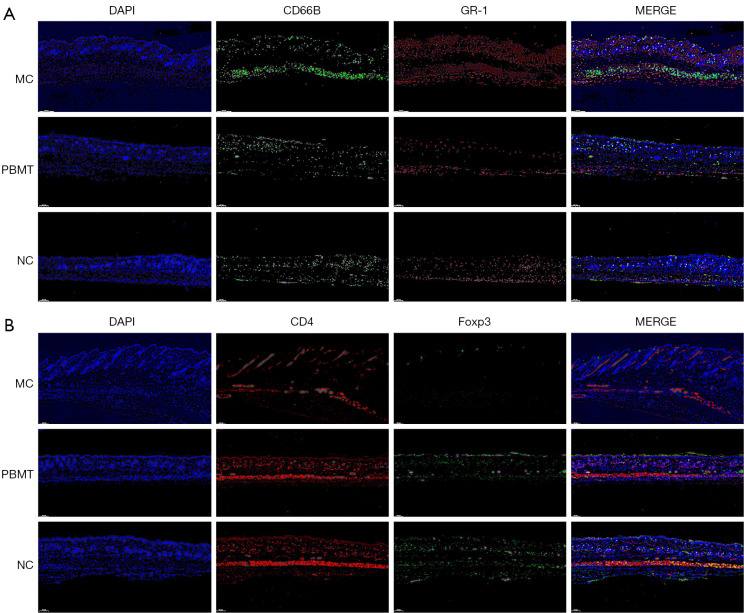
Figure 4.
The infiltration status of neutrophils and γδ T cells in mouse skin tissues from the NC, MC and PBMT groups, as observed by immunofluorescence staining. (A) The infiltration status of neutrophils marked by CD66B (green fluorescence) and GR-1 (red fluorescence). Scale bar =100 µm. (B) The infiltration status of Treg cells as determined by CD4 staining (red fluorescence) and Foxp3 staining (green fluorescence). Scale bar =100 µm. MC, model control; PBMT, photobiomodulation therapy; NC, negative control; Treg, regulatory T cell.

