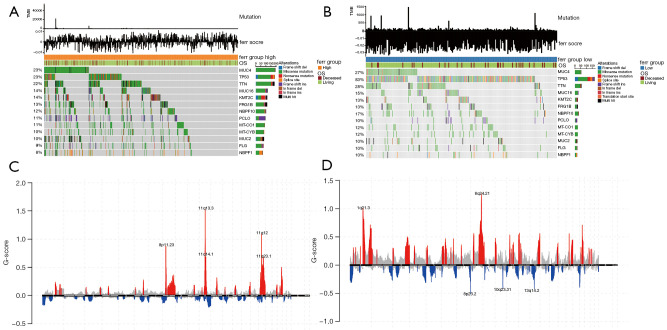
Figure 7.
Analysis of the molecular characteristics of the high and low ferr.score groups using the TCGA data. (A,B) The distribution of gene mutations in samples with high and low ferr.scores. (C,D) The distribution of copy number and amplification of deletion regions in samples with high and low ferr.scores. (C) The group with high ferr.score; (D) the group with low ferr.score. TMB, tumor mutation burden.

