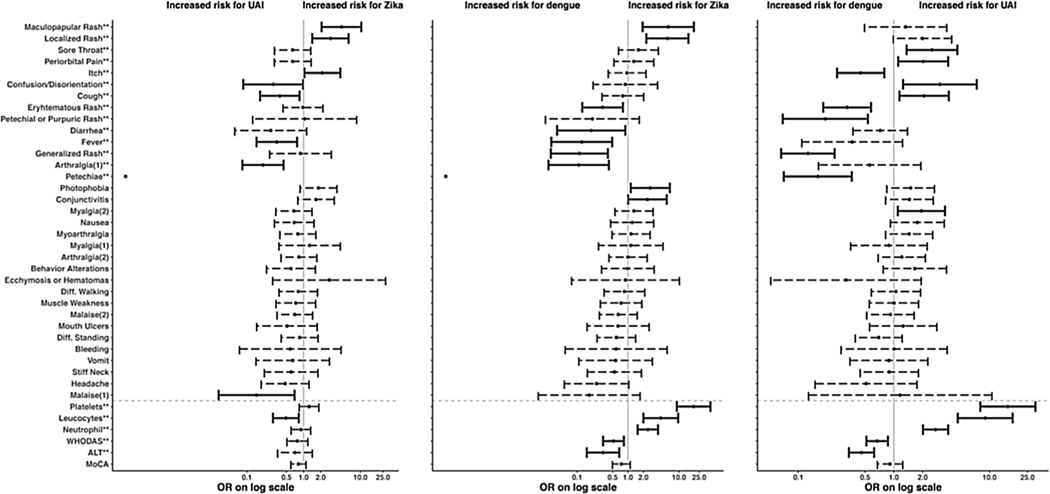
Figure 2.
Odds ratios and 95% confidence intervals for the comparisons of disease groups for each characteristic in a univariate model.
The darker lines indicate the odds ratios that are significantly different from 1 at the 0.05 level. Characteristics marked with ** represent the significance from a likelihood ratio test comparing a model with the characteristic versus intercept alone. Characteristics below the gray dashed line are continuous and standardized. Note that there is no interval associated with petechiae for comparisons with Zika; there were no Zika participants with this characteristic and therefore the interval was not accurately estimable. (1) Indicates self-reported eligibility symptoms collected 0–7 days after symptom onset; (2) indicates self-reported symptoms collected 3–10 days after symptom onset.

