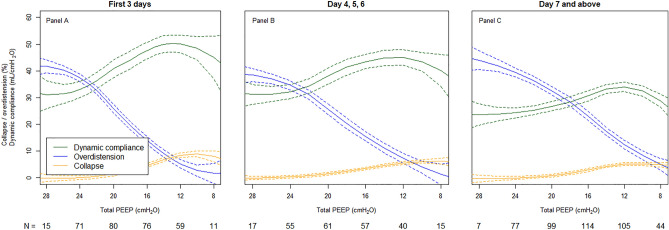
Figure 3.
Dynamic respiratory system compliance, alveolar overdistension, and alveolar collapse for the whole population from admission to beyond a week after. EIT population curves that show mean (solid lines), dynamic compliance (green), overdistension (blue), and collapse (yellow) with 95% confidence intervals (dashed lines) for the whole population from PEEP steps 28 to 8 cmH2O over time for the first 3 days (A), day 4, 5 and 6 (B) and day 7 and above (C).

