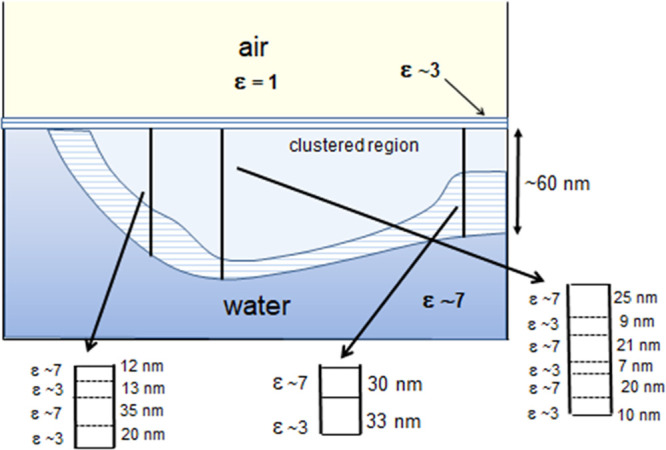
Figure 10.

Schematic diagram of cluster arrangement formation based on an inference from the force vs distance curves measured probing various regions of the air/water interface (Figures 6–8). These curves give the force acting on the tip in the normal direction to the interface, measured probing various regions of the interfacial surface.
