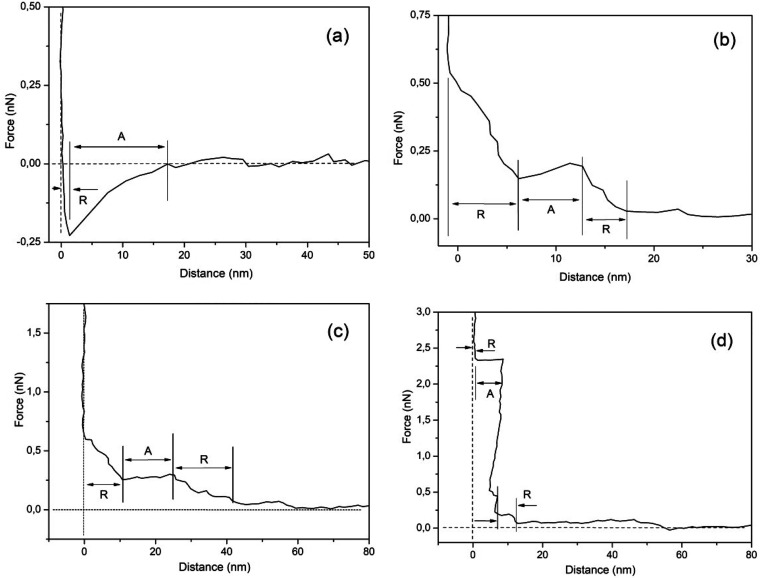
Figure 2.
Interfacial HOPG immersed in 1 M NaCl solution measured force profiles as a function of the distance to the interface for (a) t ≈ 0 min, (b) t = 63 min, (c) t = 254 min, and (d) t = 264 min. A indicates attractive and R repulsive regions. The region indicated by R in (a) gives the extension of the interfacial boundary at immersion.

